

511
Fluorescent Dissolved Organic Matter in Natural Waters
(continued)
Type of samples/locations
Origin of DOM
Filtration
Irradiation
time
(h/days)
Solar
intensity
(MJm
−2 )
Changes in fluorescence intensities
References
size/type (μm)
Photoirradiation Microbial Photoirradiation Microbial
Peak C-region
Peak T- and T
UV -regions
%
%
Humic acid, Lake Erie: surface
water, 42ºN
Allochthonous/
autochthonous
0.45
12
nd
np
na
na
na
Winter et al. (2007)
Humic acid, Sanctuary Pond:
surface water, 41ºN
Allochthonous/
autochthonous
0.45
12
nd
−(63–81)
na
na
na
Winter et al. (2007)
Tryptophan, Luther Marsh:
surface water, 43ºN
Allochthonous/
autochthonous
0.45
12
nd
na
na
(+) 62
0
Winter et al. (2007)
Tryptophan, Mill Creek: surface
water, 43ºN
Allochthonous/
autochthonous
0.45
12
nd
na
na
−(81–88)
0
Winter et al. (2007)
Tryptophan, Lake Erie: surface
water, 42ºN
Allochthonous/
autochthonous
0.45
12
nd
na
na
−(72–82)
0
Winter et al. (2007)
Tryptophan, Fish food
Allochthonous/
autochthonous
0.45
12
nd
na
na
−(54–66)
(+) (20–40) Winter et al. (2007)
Tyrosine, Bannister Lake: surface
water, 43ºN
Allochthonous/
autochthonous
0.45
12
nd
na
na
(+) 68,
−34
0
Winter et al. (2007)
Tyrosine, Lake Erie: surface
water, 42ºN
Allochthonous/
autochthonous
0.45
12
nd
na
na
(+) 1,
−19
0
Winter et al. (2007)
Tyrosine, Sanctuary Pond:
surface water, 41ºN
Allochthonous/
autochthonous
0.45
12
nd
na
na
−(73–100)
0
Winter et al. (2007)
Satilla Estuary
Allochthonous/
autochthonous
0.20
70 (irradiated) nd
−61
na
−45
na
Moran et al. (2000)
Satilla Estuary
Allochthonous/
autochthonous
0.20
70 (irradiated) nd
−67
“
−37
“
Moran et al. (2000)
Satilla Estuary
Allochthonous/
autochthonous
0.20
51 (dark)
nd
na
−12
na
(+) 112
Moran et al. (2000)
Satilla Estuary
Allochthonous/
autochthonous
0.20
51 (dark)
nd
na
−1
na
(+) 23
Moran et al. (2000)
Estuary, Beaufort Sea, 69ºN
Allochthonous/
autochthonous
0.20
72 h (summer) nd
−(47–60)
nd
nd
nd
Osburn et al. (2009)
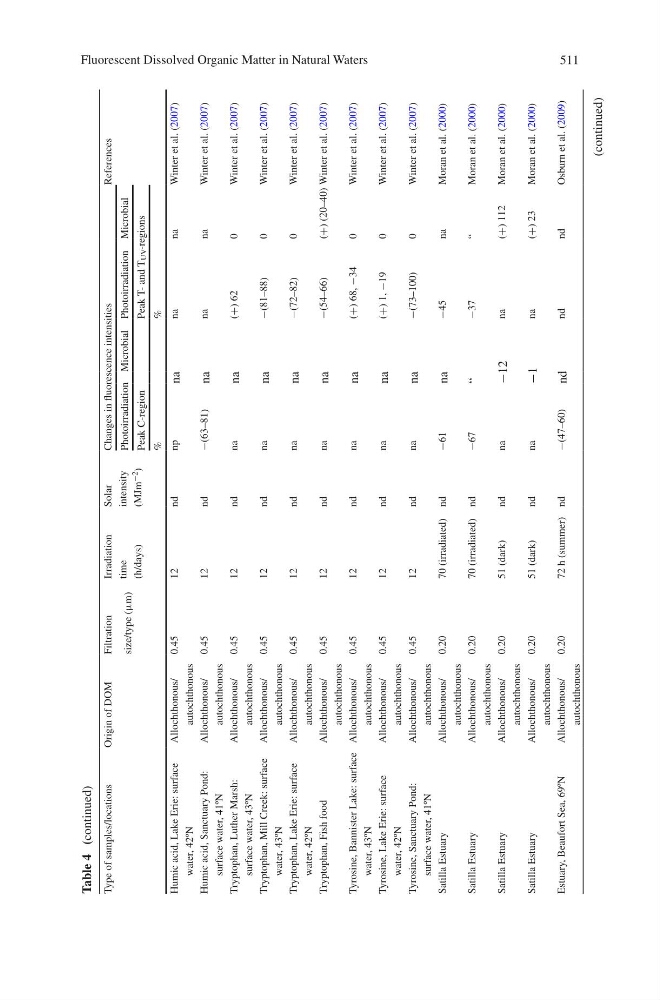
Table 4 (continued)
Fluorescent Dissolved Organic Matter in Natural Waters
(continued)
Type of samples/locations
Origin of DOM
Filtration
Irradiation
time
(h/days)
Solar
intensity
(MJm
−2 )
Changes in fluorescence intensities
References
size/type (μm)
Photoirradiation Microbial Photoirradiation Microbial
Peak C-region
Peak T- and T
UV -regions
%
%
Humic acid, Lake Erie: surface
water, 42ºN
Allochthonous/
autochthonous
0.45
12
nd
np
na
na
na
Winter et al. (2007)
Humic acid, Sanctuary Pond:
surface water, 41ºN
Allochthonous/
autochthonous
0.45
12
nd
−(63–81)
na
na
na
Winter et al. (2007)
Tryptophan, Luther Marsh:
surface water, 43ºN
Allochthonous/
autochthonous
0.45
12
nd
na
na
(+) 62
0
Winter et al. (2007)
Tryptophan, Mill Creek: surface
water, 43ºN
Allochthonous/
autochthonous
0.45
12
nd
na
na
−(81–88)
0
Winter et al. (2007)
Tryptophan, Lake Erie: surface
water, 42ºN
Allochthonous/
autochthonous
0.45
12
nd
na
na
−(72–82)
0
Winter et al. (2007)
Tryptophan, Fish food
Allochthonous/
autochthonous
0.45
12
nd
na
na
−(54–66)
(+) (20–40) Winter et al. (2007)
Tyrosine, Bannister Lake: surface
water, 43ºN
Allochthonous/
autochthonous
0.45
12
nd
na
na
(+) 68,
−34
0
Winter et al. (2007)
Tyrosine, Lake Erie: surface
water, 42ºN
Allochthonous/
autochthonous
0.45
12
nd
na
na
(+) 1,
−19
0
Winter et al. (2007)
Tyrosine, Sanctuary Pond:
surface water, 41ºN
Allochthonous/
autochthonous
0.45
12
nd
na
na
−(73–100)
0
Winter et al. (2007)
Satilla Estuary
Allochthonous/
autochthonous
0.20
70 (irradiated) nd
−61
na
−45
na
Moran et al. (2000)
Satilla Estuary
Allochthonous/
autochthonous
0.20
70 (irradiated) nd
−67
“
−37
“
Moran et al. (2000)
Satilla Estuary
Allochthonous/
autochthonous
0.20
51 (dark)
nd
na
−12
na
(+) 112
Moran et al. (2000)
Satilla Estuary
Allochthonous/
autochthonous
0.20
51 (dark)
nd
na
−1
na
(+) 23
Moran et al. (2000)
Estuary, Beaufort Sea, 69ºN
Allochthonous/
autochthonous
0.20
72 h (summer) nd
−(47–60)
nd
nd
nd
Osburn et al. (2009)
Table 4 (continued)