

487
Fluorescent Dissolved Organic Matter in Natural Waters
in seawater samples as well as standard samples suggests that the fluorescence of
tryptophan is approximately four times higher than that of tyrosine (Yamashita and
Tanoue 2003a; Mostofa KMG and Sakugawa LH, unpublished data). The molecular formula of tyrosine is C 9 H 11 NO 3 and its molecular weight is 181.19. The
different chemical structure of tyrosine compared to tryptophan (Fig. 3t) could
account for its much lower fluorescence intensity (Yamashita and Tanoue 2003a;
Mostofa KMG et al., unpublished data).
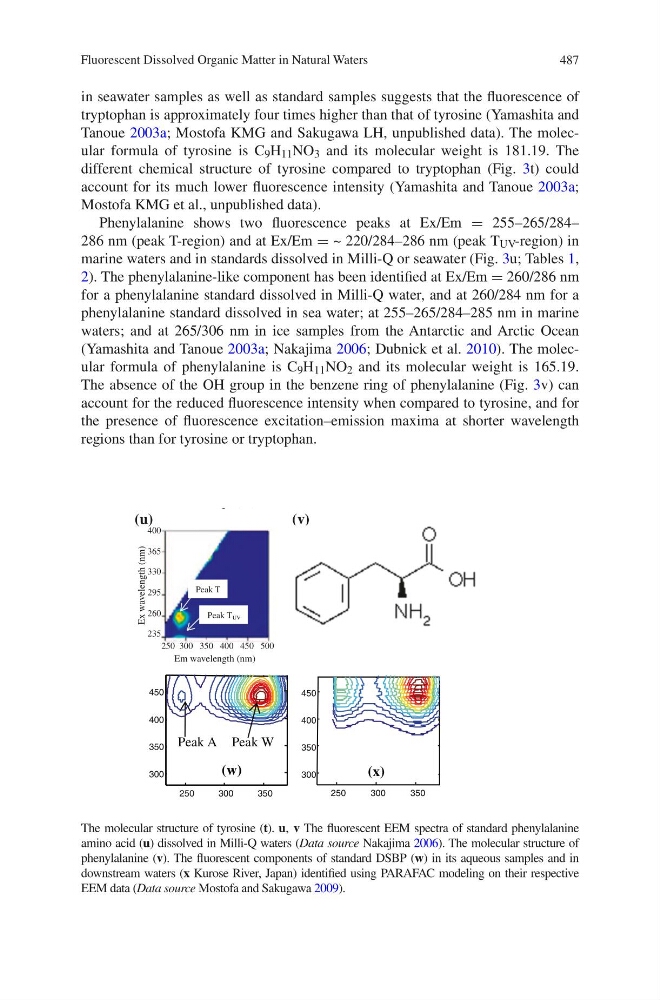
Phenylalanine shows two fluorescence peaks at Ex/Em = 255–265/284–
286 nm (peak T-region) and at Ex/Em = ~ 220/284–286 nm (peak T UV -region) in
marine waters and in standards dissolved in Milli-Q or seawater (Fig. 3u; Tables 1,
2). The phenylalanine-like component has been identified at Ex/Em = 260/286 nm
for a phenylalanine standard dissolved in Milli-Q water, and at 260/284 nm for a
phenylalanine standard dissolved in sea water; at 255–265/284–285 nm in marine
waters; and at 265/306 nm in ice samples from the Antarctic and Arctic Ocean
(Yamashita and Tanoue 2003a; Nakajima 2006; Dubnick et al. 2010). The molecular formula of phenylalanine is C 9 H 11 NO 2 and its molecular weight is 165.19.
The absence of the OH group in the benzene ring of phenylalanine (Fig. 3v) can
account for the reduced fluorescence intensity when compared to tyrosine, and for
the presence of fluorescence excitation–emission maxima at shorter wavelength
regions than for tyrosine or tryptophan.
-
NH
CH2
CH
NH3
CO2
+
-
NH
CH2
CH
NH3
CO2
+
NH 3
+
CH
CO 2
-
NH 2
CH
CO 2 H
…...
…
.
(r)
(o)
(p)
(q)
Peak T
Peak TUV
400
365
330
295
260
235
250 300 350 400 450 500
Ex wavelength (nm)
Em wavelength (nm)
Peak T
Peak T UV
(s)
(t)
400
365
330
295
260
235
Ex wavelength (nm)
250 300 350 400 450 500
Em wavelength (nm)
Peak T
Peak T UV
(u)
(v)
(x)
(w)
Peak W
Peak A
250
300
350
300
350
400
450
300
350
300
350
400
450
250
The molecular structure of tyrosine (t). u, v The fluorescent EEM spectra of standard phenylalanine
amino acid (u) dissolved in Milli-Q waters (Data source Nakajima 2006). The molecular structure of
phenylalanine (v). The fluorescent components of standard DSBP (w) in its aqueous samples and in
downstream waters (x Kurose River, Japan) identified using PARAFAC modeling on their respective
EEM data (Data source Mostofa and Sakugawa 2009).
Fluorescent Dissolved Organic Matter in Natural Waters
in seawater samples as well as standard samples suggests that the fluorescence of
tryptophan is approximately four times higher than that of tyrosine (Yamashita and
Tanoue 2003a; Mostofa KMG and Sakugawa LH, unpublished data). The molecular formula of tyrosine is C 9 H 11 NO 3 and its molecular weight is 181.19. The
different chemical structure of tyrosine compared to tryptophan (Fig. 3t) could
account for its much lower fluorescence intensity (Yamashita and Tanoue 2003a;
Mostofa KMG et al., unpublished data).
Phenylalanine shows two fluorescence peaks at Ex/Em = 255–265/284–
286 nm (peak T-region) and at Ex/Em = ~ 220/284–286 nm (peak T UV -region) in
marine waters and in standards dissolved in Milli-Q or seawater (Fig. 3u; Tables 1,
2). The phenylalanine-like component has been identified at Ex/Em = 260/286 nm
for a phenylalanine standard dissolved in Milli-Q water, and at 260/284 nm for a
phenylalanine standard dissolved in sea water; at 255–265/284–285 nm in marine
waters; and at 265/306 nm in ice samples from the Antarctic and Arctic Ocean
(Yamashita and Tanoue 2003a; Nakajima 2006; Dubnick et al. 2010). The molecular formula of phenylalanine is C 9 H 11 NO 2 and its molecular weight is 165.19.
The absence of the OH group in the benzene ring of phenylalanine (Fig. 3v) can
account for the reduced fluorescence intensity when compared to tyrosine, and for
the presence of fluorescence excitation–emission maxima at shorter wavelength
regions than for tyrosine or tryptophan.
-
NH
CH2
CH
NH3
CO2
+
-
NH
CH2
CH
NH3
CO2
+
NH 3
+
CH
CO 2
-
NH 2
CH
CO 2 H
…...
…
.
(r)
(o)
(p)
(q)
Peak T
Peak TUV
400
365
330
295
260
235
250 300 350 400 450 500
Ex wavelength (nm)
Em wavelength (nm)
Peak T
Peak T UV
(s)
(t)
400
365
330
295
260
235
Ex wavelength (nm)
250 300 350 400 450 500
Em wavelength (nm)
Peak T
Peak T UV
(u)
(v)
(x)
(w)
Peak W
Peak A
250
300
350
300
350
400
450
300
350
300
350
400
450
250
The molecular structure of tyrosine (t). u, v The fluorescent EEM spectra of standard phenylalanine
amino acid (u) dissolved in Milli-Q waters (Data source Nakajima 2006). The molecular structure of
phenylalanine (v). The fluorescent components of standard DSBP (w) in its aqueous samples and in
downstream waters (x Kurose River, Japan) identified using PARAFAC modeling on their respective
EEM data (Data source Mostofa and Sakugawa 2009).