

474
K. M. G. Mostofa et al.
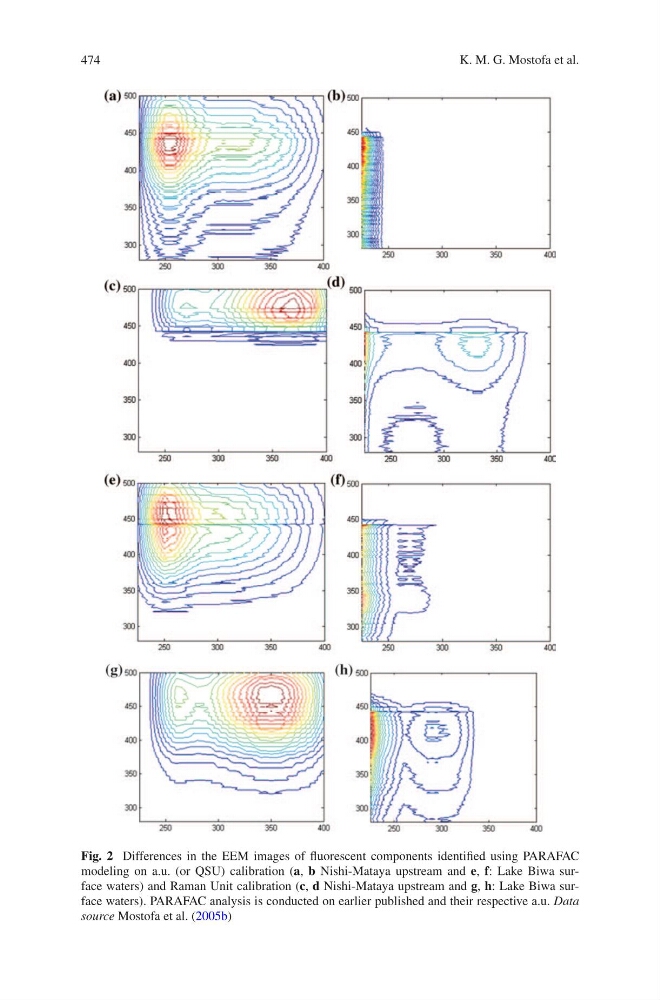
Fig. 2 Differences in the EEM images of fluorescent components identified using PARAFAC
modeling on a.u. (or QSU) calibration (a, b Nishi-Mataya upstream and e, f: Lake Biwa surface waters) and Raman Unit calibration (c, d Nishi-Mataya upstream and g, h: Lake Biwa surface waters). PARAFAC analysis is conducted on earlier published and their respective a.u. Data
source Mostofa et al. (2005b)
K. M. G. Mostofa et al.
Fig. 2 Differences in the EEM images of fluorescent components identified using PARAFAC
modeling on a.u. (or QSU) calibration (a, b Nishi-Mataya upstream and e, f: Lake Biwa surface waters) and Raman Unit calibration (c, d Nishi-Mataya upstream and g, h: Lake Biwa surface waters). PARAFAC analysis is conducted on earlier published and their respective a.u. Data
source Mostofa et al. (2005b)