

403
Colored and Chromophoric Dissolved Organic Matter in Natural Waters
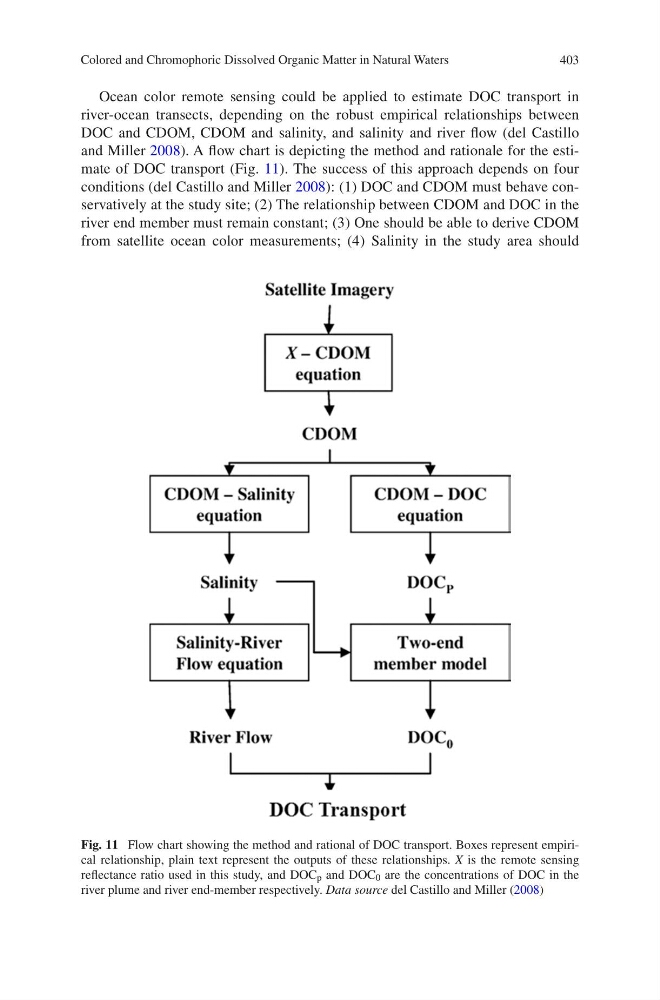
Ocean color remote sensing could be applied to estimate DOC transport in
river-ocean transects, depending on the robust empirical relationships between
DOC and CDOM, CDOM and salinity, and salinity and river flow (del Castillo
and Miller 2008). A flow chart is depicting the method and rationale for the estimate of DOC transport (Fig. 11). The success of this approach depends on four
conditions (del Castillo and Miller 2008): (1) DOC and CDOM must behave conservatively at the study site; (2) The relationship between CDOM and DOC in the
river end member must remain constant; (3) One should be able to derive CDOM
from satellite ocean color measurements; (4) Salinity in the study area should
Fig. 11 Flow chart showing the method and rational of DOC transport. Boxes represent empirical relationship, plain text represent the outputs of these relationships. X is the remote sensing
reflectance ratio used in this study, and DOC p and DOC 0 are the concentrations of DOC in the
river plume and river end-member respectively. Data source del Castillo and Miller (2008)
Colored and Chromophoric Dissolved Organic Matter in Natural Waters
Ocean color remote sensing could be applied to estimate DOC transport in
river-ocean transects, depending on the robust empirical relationships between
DOC and CDOM, CDOM and salinity, and salinity and river flow (del Castillo
and Miller 2008). A flow chart is depicting the method and rationale for the estimate of DOC transport (Fig. 11). The success of this approach depends on four
conditions (del Castillo and Miller 2008): (1) DOC and CDOM must behave conservatively at the study site; (2) The relationship between CDOM and DOC in the
river end member must remain constant; (3) One should be able to derive CDOM
from satellite ocean color measurements; (4) Salinity in the study area should
Fig. 11 Flow chart showing the method and rational of DOC transport. Boxes represent empirical relationship, plain text represent the outputs of these relationships. X is the remote sensing
reflectance ratio used in this study, and DOC p and DOC 0 are the concentrations of DOC in the
river plume and river end-member respectively. Data source del Castillo and Miller (2008)