

279
Photoinduced and Microbial Degradation
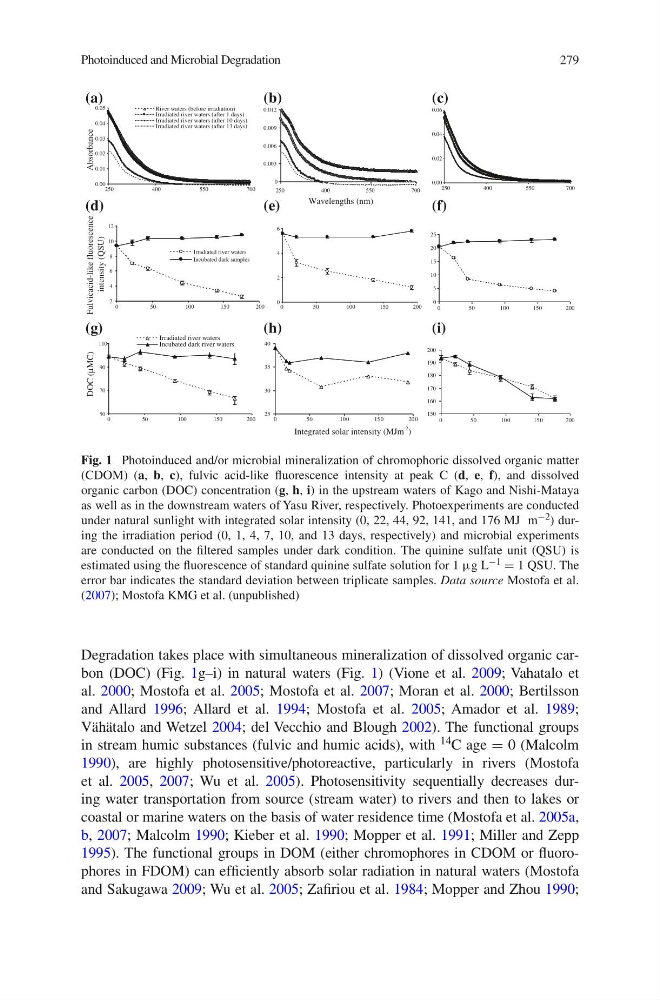
Degradation takes place with simultaneous mineralization of dissolved organic carbon (DOC) (Fig. 1g–i) in natural waters (Fig. 1) (Vione et al. 2009; Vahatalo et
al. 2000; Mostofa et al. 2005; Mostofa et al. 2007; Moran et al. 2000; Bertilsson
and Allard 1996; Allard et al. 1994; Mostofa et al. 2005; Amador et al. 1989;
Vähätalo and Wetzel 2004; del Vecchio and Blough 2002). The functional groups
in stream humic substances (fulvic and humic acids), with 14 C age = 0 (Malcolm
1990), are highly photosensitive/photoreactive, particularly in rivers (Mostofa
et al. 2005, 2007; Wu et al. 2005). Photosensitivity sequentially decreases during water transportation from source (stream water) to rivers and then to lakes or
coastal or marine waters on the basis of water residence time (Mostofa et al. 2005a,
b, 2007; Malcolm 1990; Kieber et al. 1990; Mopper et al. 1991; Miller and Zepp
1995). The functional groups in DOM (either chromophores in CDOM or fluorophores in FDOM) can efficiently absorb solar radiation in natural waters (Mostofa
and Sakugawa 2009; Wu et al. 2005; Zafiriou et al. 1984; Mopper and Zhou 1990;
0.00
0.02
0.04
0.06
250
400
550
700
(c)
0.00
0.01
0.02
0.03
0.04
0.05
250
4 00
550
7 00
River waters (before irradiation)
Irradiated river waters (after 1 days)
Irradiated river waters (after 10 days)
Irradiated river waters (after 13 days)
(a)
Absorbance
0
0.003
0.006
0.009
0.012
250
400
550
700
(b)
(f)
(d)
(e)
(i)
(g)
(h)
Wavelengths (nm)
2
4
6
8
10
12
0
5 0
1 00
150
2 00
Irradiated river waters
Incubated dark samples
Fulvicacid-like fluorescence
intensity (QSU)
0
2
4
6
0
5 0
100
150
200
0
5
10
15
20
25
0
5 0
1 00
150
200
50
70
90
110
0
5 0
1 00
150
2 00
Irradiated river waters
Incubated dark river waters
25
30
35
40
0
5 0
1 00
150
2 00
150
160
170
180
190
200
0
5 0
1 00
150
200
Integrated solar intensity (MJm
-2 )
DOC (µMC)
Fig. 1 Photoinduced and/or microbial mineralization of chromophoric dissolved organic matter
(CDOM) (a, b, c), fulvic acid-like fluorescence intensity at peak C (d, e, f), and dissolved
organic carbon (DOC) concentration (g, h, i) in the upstream waters of Kago and Nishi-Mataya
as well as in the downstream waters of Yasu River, respectively. Photoexperiments are conducted
under natural sunlight with integrated solar intensity (0, 22, 44, 92, 141, and 176 MJ m −2 ) during the irradiation period (0, 1, 4, 7, 10, and 13 days, respectively) and microbial experiments
are conducted on the filtered samples under dark condition. The quinine sulfate unit (QSU) is
estimated using the fluorescence of standard quinine sulfate solution for 1 μg L −1 = 1 QSU. The
error bar indicates the standard deviation between triplicate samples. Data source Mostofa et al.
(2007); Mostofa KMG et al. (unpublished)
Photoinduced and Microbial Degradation
Degradation takes place with simultaneous mineralization of dissolved organic carbon (DOC) (Fig. 1g–i) in natural waters (Fig. 1) (Vione et al. 2009; Vahatalo et
al. 2000; Mostofa et al. 2005; Mostofa et al. 2007; Moran et al. 2000; Bertilsson
and Allard 1996; Allard et al. 1994; Mostofa et al. 2005; Amador et al. 1989;
Vähätalo and Wetzel 2004; del Vecchio and Blough 2002). The functional groups
in stream humic substances (fulvic and humic acids), with 14 C age = 0 (Malcolm
1990), are highly photosensitive/photoreactive, particularly in rivers (Mostofa
et al. 2005, 2007; Wu et al. 2005). Photosensitivity sequentially decreases during water transportation from source (stream water) to rivers and then to lakes or
coastal or marine waters on the basis of water residence time (Mostofa et al. 2005a,
b, 2007; Malcolm 1990; Kieber et al. 1990; Mopper et al. 1991; Miller and Zepp
1995). The functional groups in DOM (either chromophores in CDOM or fluorophores in FDOM) can efficiently absorb solar radiation in natural waters (Mostofa
and Sakugawa 2009; Wu et al. 2005; Zafiriou et al. 1984; Mopper and Zhou 1990;
0.00
0.02
0.04
0.06
250
400
550
700
(c)
0.00
0.01
0.02
0.03
0.04
0.05
250
4 00
550
7 00
River waters (before irradiation)
Irradiated river waters (after 1 days)
Irradiated river waters (after 10 days)
Irradiated river waters (after 13 days)
(a)
Absorbance
0
0.003
0.006
0.009
0.012
250
400
550
700
(b)
(f)
(d)
(e)
(i)
(g)
(h)
Wavelengths (nm)
2
4
6
8
10
12
0
5 0
1 00
150
2 00
Irradiated river waters
Incubated dark samples
Fulvicacid-like fluorescence
intensity (QSU)
0
2
4
6
0
5 0
100
150
200
0
5
10
15
20
25
0
5 0
1 00
150
200
50
70
90
110
0
5 0
1 00
150
2 00
Irradiated river waters
Incubated dark river waters
25
30
35
40
0
5 0
1 00
150
2 00
150
160
170
180
190
200
0
5 0
1 00
150
200
Integrated solar intensity (MJm
-2 )
DOC (µMC)
Fig. 1 Photoinduced and/or microbial mineralization of chromophoric dissolved organic matter
(CDOM) (a, b, c), fulvic acid-like fluorescence intensity at peak C (d, e, f), and dissolved
organic carbon (DOC) concentration (g, h, i) in the upstream waters of Kago and Nishi-Mataya
as well as in the downstream waters of Yasu River, respectively. Photoexperiments are conducted
under natural sunlight with integrated solar intensity (0, 22, 44, 92, 141, and 176 MJ m −2 ) during the irradiation period (0, 1, 4, 7, 10, and 13 days, respectively) and microbial experiments
are conducted on the filtered samples under dark condition. The quinine sulfate unit (QSU) is
estimated using the fluorescence of standard quinine sulfate solution for 1 μg L −1 = 1 QSU. The
error bar indicates the standard deviation between triplicate samples. Data source Mostofa et al.
(2007); Mostofa KMG et al. (unpublished)