

178
K. M. G. Mostofa et al.
et al. 2001; Richard et al. 2007), and the contribution of UV-B, UV-A and photosynthetically active radiation (PAR) is 40, 33 and 27 %, respectively (Richard
et al. 2007). Production of H 2 O 2 at vertical depths depends on the penetration
of solar radiation, and decreases with an increase in depth of lakes or oceans
(Obernosterer et al. 2001). A model study on a freshwater stream shows that the
H 2 O 2 concentrations over time significantly depend on photoinduced production
0
50
100
150
200
250
KR1+KR2
KR3+KR4
KR5+KR6
OR1+OR2
OR3+OR4
OR5+OR6
H2O2 (nM)
Spring
Summer
Autumn
Winter
(a)
ab
ab b
b
a
a
a
b
a
a
a
a
a
a
a
a
a
a
0
50
100
150
200
250
KR1+KR2 KR3+KR4 KR5+KR6 OR1+OR2 OR3+OR4 OR5+OR6
Sampling
ROOHs (nM)
bc
a
b
b
ab
b
b
ab
a
c
b
b
a
a
a
b
a
a
(b)
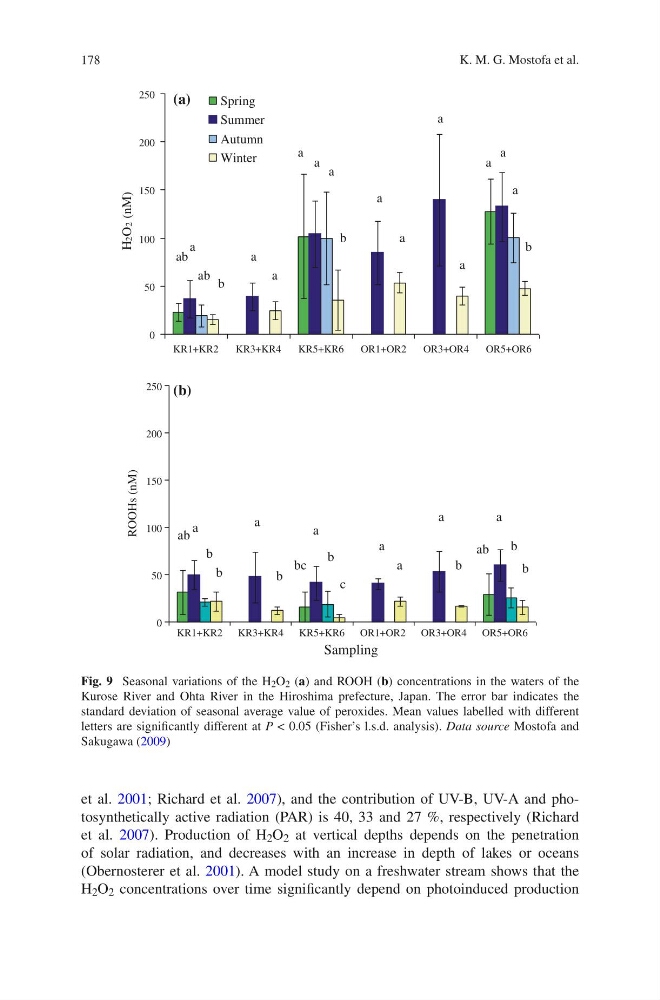
Fig. 9 Seasonal variations of the H 2 O 2 (a) and ROOH (b) concentrations in the waters of the
Kurose River and Ohta River in the Hiroshima prefecture, Japan. The error bar indicates the
standard deviation of seasonal average value of peroxides. Mean values labelled with different
letters are significantly different at P < 0.05 (Fisher’s l.s.d. analysis). Data source Mostofa and
Sakugawa (2009)
K. M. G. Mostofa et al.
et al. 2001; Richard et al. 2007), and the contribution of UV-B, UV-A and photosynthetically active radiation (PAR) is 40, 33 and 27 %, respectively (Richard
et al. 2007). Production of H 2 O 2 at vertical depths depends on the penetration
of solar radiation, and decreases with an increase in depth of lakes or oceans
(Obernosterer et al. 2001). A model study on a freshwater stream shows that the
H 2 O 2 concentrations over time significantly depend on photoinduced production
0
50
100
150
200
250
KR1+KR2
KR3+KR4
KR5+KR6
OR1+OR2
OR3+OR4
OR5+OR6
H2O2 (nM)
Spring
Summer
Autumn
Winter
(a)
ab
ab b
b
a
a
a
b
a
a
a
a
a
a
a
a
a
a
0
50
100
150
200
250
KR1+KR2 KR3+KR4 KR5+KR6 OR1+OR2 OR3+OR4 OR5+OR6
Sampling
ROOHs (nM)
bc
a
b
b
ab
b
b
ab
a
c
b
b
a
a
a
b
a
a
(b)
Fig. 9 Seasonal variations of the H 2 O 2 (a) and ROOH (b) concentrations in the waters of the
Kurose River and Ohta River in the Hiroshima prefecture, Japan. The error bar indicates the
standard deviation of seasonal average value of peroxides. Mean values labelled with different
letters are significantly different at P < 0.05 (Fisher’s l.s.d. analysis). Data source Mostofa and
Sakugawa (2009)