

11
Dissolved Organic Matter in Natural Waters
et al. 2004; Yamashita and Tanoue 2004, 2008; Wada et al. 2007; Hanamachi et al.
2008; Ortega-Retuerta et al. 2009; Aoki et al. 2008; Biddanda and Benner 1997;
Hulatt et al. 2009; Bertilsson and Jones 2003; Chen and Gardner 2004; Stedmon
and Markager 2005a; Stedmon et al. 2007a, b; Wetz and Wheeler 2007; Zhao et al.
2009).
Re-suspension of algae or phytoplankton in ultrapure water (Milli-Q), artificial sea water and natural waters can release new organic compounds, either
under irradiation or under dark incubation. These organic substances, produced
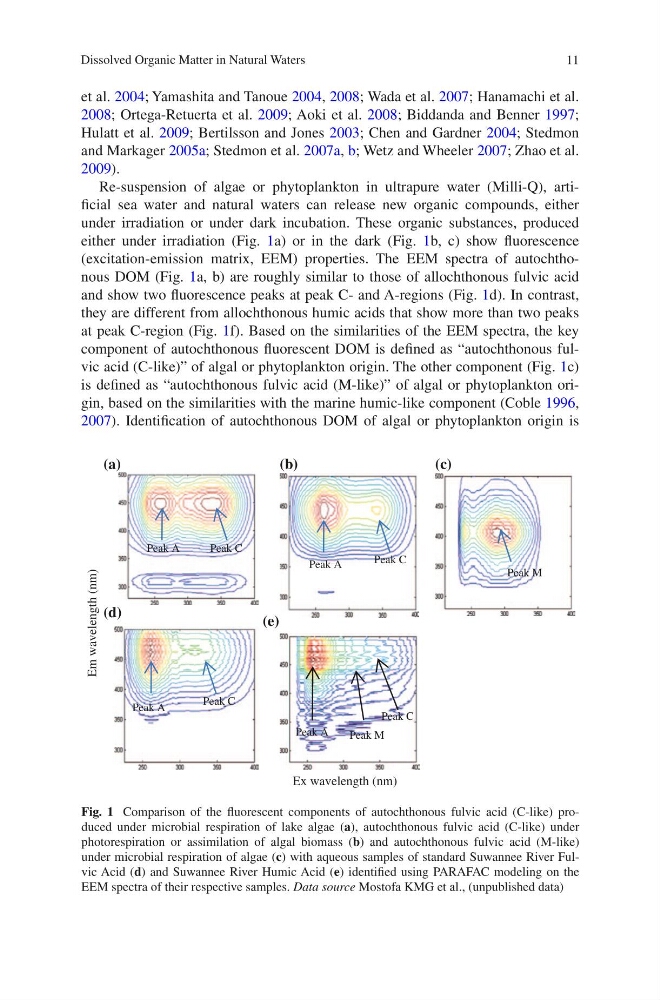
either under irradiation (Fig. 1a) or in the dark (Fig. 1b, c) show fluorescence
(excitation-emission matrix, EEM) properties. The EEM spectra of autochthonous DOM (Fig. 1a, b) are roughly similar to those of allochthonous fulvic acid
and show two fluorescence peaks at peak C- and A-regions (Fig. 1d). In contrast,
they are different from allochthonous humic acids that show more than two peaks
at peak C-region (Fig. 1f). Based on the similarities of the EEM spectra, the key
component of autochthonous fluorescent DOM is defined as “autochthonous fulvic acid (C-like)” of algal or phytoplankton origin. The other component (Fig. 1c)
is defined as “autochthonous fulvic acid (M-like)” of algal or phytoplankton origin, based on the similarities with the marine humic-like component (Coble 1996,
2007). Identification of autochthonous DOM of algal or phytoplankton origin is
Peak A
Peak C
Peak M
(b)
(a)
Ex wavelength (nm)
Em wavelength (nm)
(e)
(d)
Peak A
Peak C
Peak A
Peak C
(c)
Peak M
Peak A
Peak C
Fig. 1 Comparison of the fluorescent components of autochthonous fulvic acid (C-like) produced under microbial respiration of lake algae (a), autochthonous fulvic acid (C-like) under
photorespiration or assimilation of algal biomass (b) and autochthonous fulvic acid (M-like)
under microbial respiration of algae (c) with aqueous samples of standard Suwannee River Fulvic Acid (d) and Suwannee River Humic Acid (e) identified using PARAFAC modeling on the
EEM spectra of their respective samples. Data source Mostofa KMG et al., (unpublished data)
Dissolved Organic Matter in Natural Waters
et al. 2004; Yamashita and Tanoue 2004, 2008; Wada et al. 2007; Hanamachi et al.
2008; Ortega-Retuerta et al. 2009; Aoki et al. 2008; Biddanda and Benner 1997;
Hulatt et al. 2009; Bertilsson and Jones 2003; Chen and Gardner 2004; Stedmon
and Markager 2005a; Stedmon et al. 2007a, b; Wetz and Wheeler 2007; Zhao et al.
2009).
Re-suspension of algae or phytoplankton in ultrapure water (Milli-Q), artificial sea water and natural waters can release new organic compounds, either
under irradiation or under dark incubation. These organic substances, produced
either under irradiation (Fig. 1a) or in the dark (Fig. 1b, c) show fluorescence
(excitation-emission matrix, EEM) properties. The EEM spectra of autochthonous DOM (Fig. 1a, b) are roughly similar to those of allochthonous fulvic acid
and show two fluorescence peaks at peak C- and A-regions (Fig. 1d). In contrast,
they are different from allochthonous humic acids that show more than two peaks
at peak C-region (Fig. 1f). Based on the similarities of the EEM spectra, the key
component of autochthonous fluorescent DOM is defined as “autochthonous fulvic acid (C-like)” of algal or phytoplankton origin. The other component (Fig. 1c)
is defined as “autochthonous fulvic acid (M-like)” of algal or phytoplankton origin, based on the similarities with the marine humic-like component (Coble 1996,
2007). Identification of autochthonous DOM of algal or phytoplankton origin is
Peak A
Peak C
Peak M
(b)
(a)
Ex wavelength (nm)
Em wavelength (nm)
(e)
(d)
Peak A
Peak C
Peak A
Peak C
(c)
Peak M
Peak A
Peak C
Fig. 1 Comparison of the fluorescent components of autochthonous fulvic acid (C-like) produced under microbial respiration of lake algae (a), autochthonous fulvic acid (C-like) under
photorespiration or assimilation of algal biomass (b) and autochthonous fulvic acid (M-like)
under microbial respiration of algae (c) with aqueous samples of standard Suwannee River Fulvic Acid (d) and Suwannee River Humic Acid (e) identified using PARAFAC modeling on the
EEM spectra of their respective samples. Data source Mostofa KMG et al., (unpublished data)