

56
B.C. Wainman et al.
modified by reactions associated with the endoplasmic reticulum (Gurr and Harwood, 1991; Somerville and Browse, 1991). The transportation of fatty acids
between plastid and other cell compartments and the assembly of the finished
lipids are not immediately dependent on the strongly light-regulated activity of
acetyl CoA carboxylase and can occur in the dark (Gurr and Harwood, 1991).
Figure 3.1 shows that for Colpoys Bay the share of total photosynthate in
neutral lipid tends to decrease more overnight than does the share in phospholipids or glycolipids, suggesting some reallocation from neutral lipids to the other
classes. As for total lipid, however, all three classes could gain significantly in a
share of photosynthate overnight, as seen on the first and last sampling dates. The
mass of lipid in each class at the end of the dark period (T2) was significantly and
positively related to the mass at the end of the previous light phase (T I) when
regression analysis was applied to the results for all irradiance levels combined.
There was considerable scatter, however, with r2 values of only 0.53, 0.51. and
0.40 for neutral, phospho-, and glycolipid, respectively. Within irradiance levels,
there was generally no significant (i.e., P > .05) relationship between mass of lipid
at T2 and at T I .
The first and last sampling dates suffered from poor replication of the lipid class
synthesis measurements, including some large values for overnight lipid class
synthesis at some irradiance levels. For the intervening dates, all under thermally
stratified conditions, a somewhat more consistent pattern emerged when mean
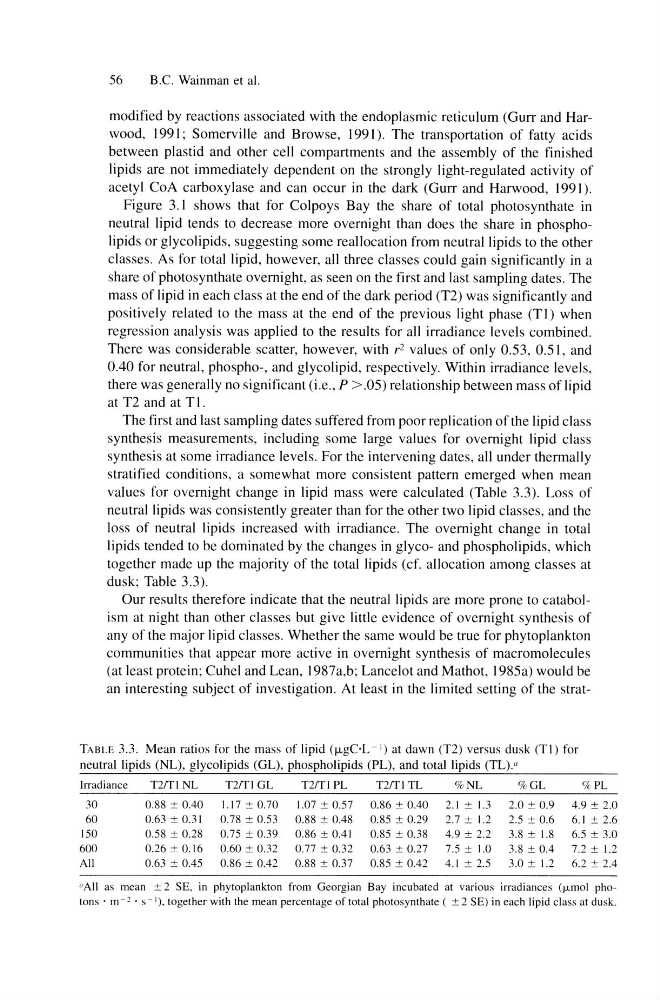
values for overnight change in lipid mass were calculated (Table 3.3). Loss of
neutral lipids was consistently greater than for the other two lipid classes, and the
loss of neutral lipids increased with irradiance. The overnight change in total
lipids tended to be dominated by the changes in glyco- and phospholipids, which
together made up the majority of the total lipids (cf. allocation among classes at
dusk; Table 3.3).
Our results therefore indicate that the neutral lipids are more prone to catabolism at night than other classes but give little evidence of overnight synthesis of
any of the major lipid classes. Whether the same would be true for phytoplankton
communities that appear more active in overnight synthesis of macromolecules
(at least protein; Cuhel and Lean, 1987a,b: Lancelot and Mathot, 1985a) would be
an interesting subject of investigation. At least in the limited setting of the stratTABLE 3.3. Mean ratios for the mass of lipid (fLgC'L -[) at dawn (T2) versus dusk (Tl) for
neutral lipids (NL), glycolipids (GL), phospholipids (PL), and total lipids (TL)."
Irradiance
T2/TI NL
T2ITI GL
T21Tl PL
T2ITI TL
%NL
%GL
'kPL
30
0.88 ± 0.40
1.17 ± 0.70
1.07 ± 0.57
0.86 ± 0.40
2.1 ± 1.3
2.0 ± 0.9
4.9 ± 2.0
60
0.63 ± 0.31
0.78 ± 0.53
0.88 ± 0.48
0.85 ± 0.29
2.7 ± 1.2
2.5 ± 0.6
6.1 ± 2.6
150
0.58 ± 0.28
0.75 ± 0.39
0.86 ± 0.41
0.85 ± 0.38
4.9 ± 2.2
3.8 ± 1.8
6.5 :!:: 3.0
600
0.26 ± 0.16
0.60 ± 0.32
0.77 ± 0.32
0.63 ± 0.27
7.5 ± 1.0
3.8 ± 0.4
7.2 ± 1.2
All
0.63 ± 0.45
0.86 ± 0.42
0.88 ± 0.37
0.85 ± 0.42
4.1 ± 2.5
3.0 ± 1.2
6.2 ± 2.4
"All as mean ± 2 SE, in phytoplankton from Georgian Bay incubated at various irradiances (Mmol photons' m -1 • S - '), together with the mean percentage of total photosynthate ( ± 2 SE) in each lipid class at dusk.
B.C. Wainman et al.
modified by reactions associated with the endoplasmic reticulum (Gurr and Harwood, 1991; Somerville and Browse, 1991). The transportation of fatty acids
between plastid and other cell compartments and the assembly of the finished
lipids are not immediately dependent on the strongly light-regulated activity of
acetyl CoA carboxylase and can occur in the dark (Gurr and Harwood, 1991).
Figure 3.1 shows that for Colpoys Bay the share of total photosynthate in
neutral lipid tends to decrease more overnight than does the share in phospholipids or glycolipids, suggesting some reallocation from neutral lipids to the other
classes. As for total lipid, however, all three classes could gain significantly in a
share of photosynthate overnight, as seen on the first and last sampling dates. The
mass of lipid in each class at the end of the dark period (T2) was significantly and
positively related to the mass at the end of the previous light phase (T I) when
regression analysis was applied to the results for all irradiance levels combined.
There was considerable scatter, however, with r2 values of only 0.53, 0.51. and
0.40 for neutral, phospho-, and glycolipid, respectively. Within irradiance levels,
there was generally no significant (i.e., P > .05) relationship between mass of lipid
at T2 and at T I .
The first and last sampling dates suffered from poor replication of the lipid class
synthesis measurements, including some large values for overnight lipid class
synthesis at some irradiance levels. For the intervening dates, all under thermally
stratified conditions, a somewhat more consistent pattern emerged when mean
values for overnight change in lipid mass were calculated (Table 3.3). Loss of
neutral lipids was consistently greater than for the other two lipid classes, and the
loss of neutral lipids increased with irradiance. The overnight change in total
lipids tended to be dominated by the changes in glyco- and phospholipids, which
together made up the majority of the total lipids (cf. allocation among classes at
dusk; Table 3.3).
Our results therefore indicate that the neutral lipids are more prone to catabolism at night than other classes but give little evidence of overnight synthesis of
any of the major lipid classes. Whether the same would be true for phytoplankton
communities that appear more active in overnight synthesis of macromolecules
(at least protein; Cuhel and Lean, 1987a,b: Lancelot and Mathot, 1985a) would be
an interesting subject of investigation. At least in the limited setting of the stratTABLE 3.3. Mean ratios for the mass of lipid (fLgC'L -[) at dawn (T2) versus dusk (Tl) for
neutral lipids (NL), glycolipids (GL), phospholipids (PL), and total lipids (TL)."
Irradiance
T2/TI NL
T2ITI GL
T21Tl PL
T2ITI TL
%NL
%GL
'kPL
30
0.88 ± 0.40
1.17 ± 0.70
1.07 ± 0.57
0.86 ± 0.40
2.1 ± 1.3
2.0 ± 0.9
4.9 ± 2.0
60
0.63 ± 0.31
0.78 ± 0.53
0.88 ± 0.48
0.85 ± 0.29
2.7 ± 1.2
2.5 ± 0.6
6.1 ± 2.6
150
0.58 ± 0.28
0.75 ± 0.39
0.86 ± 0.41
0.85 ± 0.38
4.9 ± 2.2
3.8 ± 1.8
6.5 :!:: 3.0
600
0.26 ± 0.16
0.60 ± 0.32
0.77 ± 0.32
0.63 ± 0.27
7.5 ± 1.0
3.8 ± 0.4
7.2 ± 1.2
All
0.63 ± 0.45
0.86 ± 0.42
0.88 ± 0.37
0.85 ± 0.42
4.1 ± 2.5
3.0 ± 1.2
6.2 ± 2.4
"All as mean ± 2 SE, in phytoplankton from Georgian Bay incubated at various irradiances (Mmol photons' m -1 • S - '), together with the mean percentage of total photosynthate ( ± 2 SE) in each lipid class at dusk.