

102
C.E. Goulden et al.
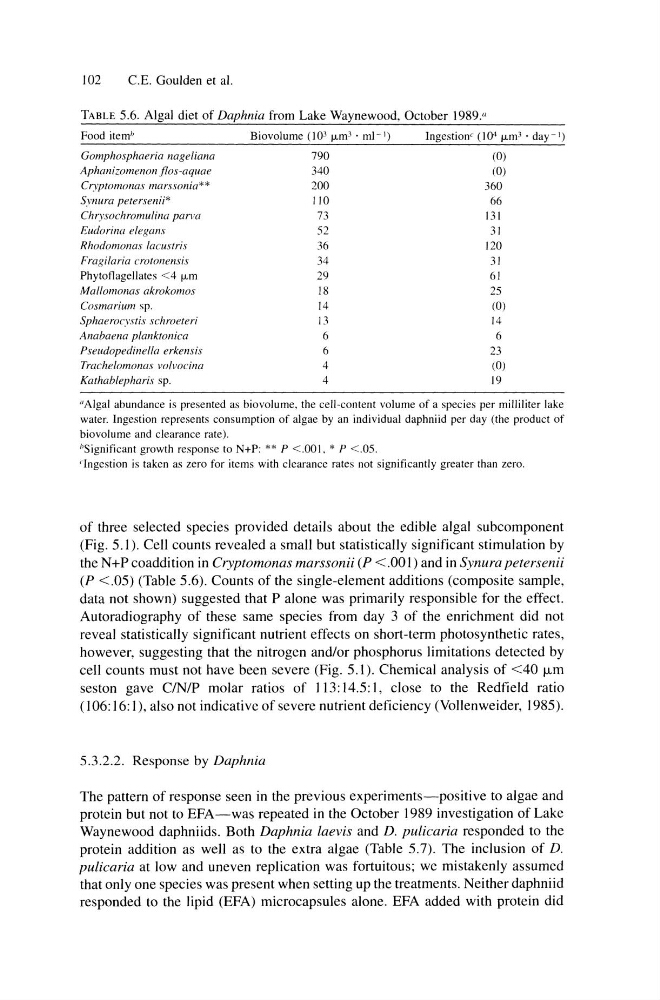
TABLE 5.6. Algal diet of Daphnia from Lake Waynewood, October 1989."
Food item h
Biovolume 003 ILm3 • rnI-')
Ingestionc 0 ()4 ILm3 • day - ')
Gomphosphaeria nageliana
790
(0)
Aphanizomenon fios-aquae
340
(0)
Cryptomonas marssonia**
200
360
Synura petersenii*
110
66
Chrysochromulina parva
73
131
Eudorina elegans
52
31
Rhodomonas lacustris
36
120
Fragilaria crotonensis
34
31
Phytoflagellates <4 ILm
29
61
Mallomonas akrokomos
18
25
Cosmarium sp.
14
(0)
Sphaerocystis schroeteri
13
14
Anabaena planktonica
6
6
Pseudopedinella erkensis
6
23
Trachelomonas volvoGina
4
(0)
Kathablepharis sp.
4
19
"Algal abundance is presented as biovolume, the cell-content volume of a species per milliliter lake
water. Ingestion represents consumption of algae by an individual daphniid per day (the product of
biovolume and clearance rate).
"Significant growth response to N+P: ** P <.001, * P <.05.
'Ingestion is taken as zero for items with clearance rates not significantly greater than zero.
of three selected species provided details about the edible algal subcomponent
(Fig. 5.1). Cell counts revealed a small but statistically significant stimulation by
the N+P co addition in Cryptomonas marssonii (P <.001) and in Synura petersenii
(P <.05) (Table 5.6). Counts of the single-element additions (composite sample,
data not shown) suggested that P alone was primarily responsible for the effect.
Autoradiography of these same species from day 3 of the enrichment did not
reveal statistically significant nutrient effects on short-term photosynthetic rates,
however, suggesting that the nitrogen and/or phosphorus limitations detected by
cell counts must not have been severe (Fig. 5.1). Chemical analysis of <40 /-Lm
seston gave CINIP molar ratios of 113: 14.5: 1, close to the Redfield ratio
(106: 16: I), also not indicative of severe nutrient deficiency (Vollenweider, 1985).
5.3.2.2. Response by Daphnia
The pattern of response seen in the previous experiments-positive to algae and
protein but not to EFA-was repeated in the October 1989 investigation of Lake
Wayne wood daphniids. Both Daphnia laevis and D. pulicaria responded to the
protein addition as well as to the extra algae (Table 5.7). The inclusion of D.
pulicaria at low and uneven replication was fortuitous; we mistakenly assumed
that only one species was present when setting up the treatments. Neither daphniid
responded to the lipid (EFA) microcapsules alone. EFA added with protein did
C.E. Goulden et al.
TABLE 5.6. Algal diet of Daphnia from Lake Waynewood, October 1989."
Food item h
Biovolume 003 ILm3 • rnI-')
Ingestionc 0 ()4 ILm3 • day - ')
Gomphosphaeria nageliana
790
(0)
Aphanizomenon fios-aquae
340
(0)
Cryptomonas marssonia**
200
360
Synura petersenii*
110
66
Chrysochromulina parva
73
131
Eudorina elegans
52
31
Rhodomonas lacustris
36
120
Fragilaria crotonensis
34
31
Phytoflagellates <4 ILm
29
61
Mallomonas akrokomos
18
25
Cosmarium sp.
14
(0)
Sphaerocystis schroeteri
13
14
Anabaena planktonica
6
6
Pseudopedinella erkensis
6
23
Trachelomonas volvoGina
4
(0)
Kathablepharis sp.
4
19
"Algal abundance is presented as biovolume, the cell-content volume of a species per milliliter lake
water. Ingestion represents consumption of algae by an individual daphniid per day (the product of
biovolume and clearance rate).
"Significant growth response to N+P: ** P <.001, * P <.05.
'Ingestion is taken as zero for items with clearance rates not significantly greater than zero.
of three selected species provided details about the edible algal subcomponent
(Fig. 5.1). Cell counts revealed a small but statistically significant stimulation by
the N+P co addition in Cryptomonas marssonii (P <.001) and in Synura petersenii
(P <.05) (Table 5.6). Counts of the single-element additions (composite sample,
data not shown) suggested that P alone was primarily responsible for the effect.
Autoradiography of these same species from day 3 of the enrichment did not
reveal statistically significant nutrient effects on short-term photosynthetic rates,
however, suggesting that the nitrogen and/or phosphorus limitations detected by
cell counts must not have been severe (Fig. 5.1). Chemical analysis of <40 /-Lm
seston gave CINIP molar ratios of 113: 14.5: 1, close to the Redfield ratio
(106: 16: I), also not indicative of severe nutrient deficiency (Vollenweider, 1985).
5.3.2.2. Response by Daphnia
The pattern of response seen in the previous experiments-positive to algae and
protein but not to EFA-was repeated in the October 1989 investigation of Lake
Wayne wood daphniids. Both Daphnia laevis and D. pulicaria responded to the
protein addition as well as to the extra algae (Table 5.7). The inclusion of D.
pulicaria at low and uneven replication was fortuitous; we mistakenly assumed
that only one species was present when setting up the treatments. Neither daphniid
responded to the lipid (EFA) microcapsules alone. EFA added with protein did