

42
J. Gomes and A.S. Menawat
0.025
0.02
~ 0.015
o=
"~ 0.01
. ==
~ 0.005
t~
0
0.12
0.08
0.04 i
0
2
4
6
8
10
Glucose Concentration (g I q)
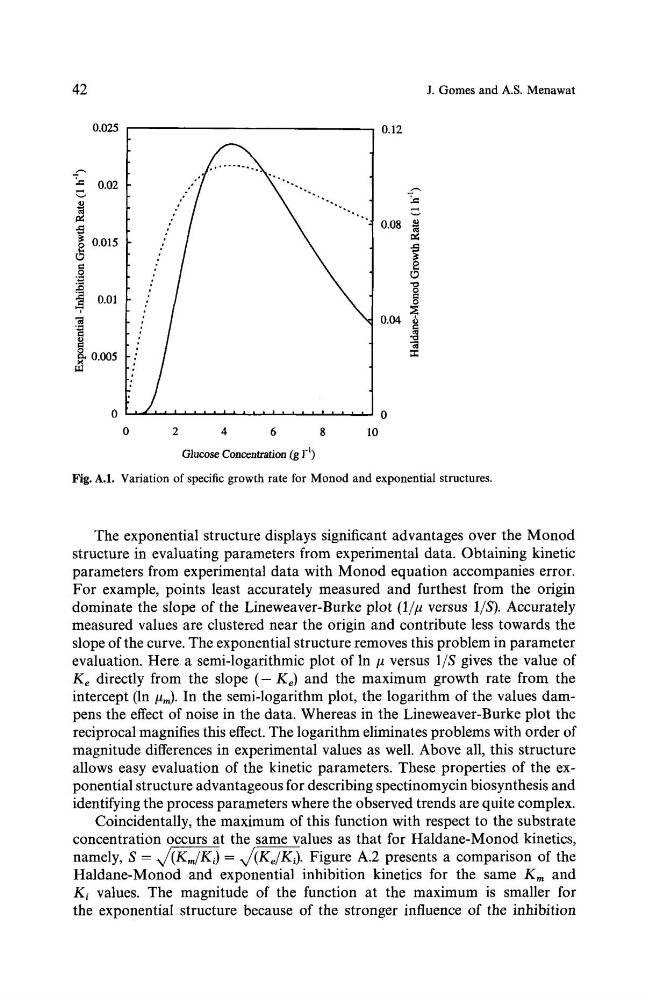
Fig. A.1. Variation of specific growth rate for Monod and exponential structures.
The exponential structure displays significant advantages over the Monod
structure in evaluating parameters from experimental data. Obtaining kinetic
parameters from experimental data with Monod equation accompanies error.
For example, points least accurately measured and furthest from the origin
dominate the slope of the Lineweaver-Burke plot (1//~ versus l/S). Accurately
measured values are clustered near the origin and contribute less towards the
slope of the curve. The exponential structure removes this problem in parameter
evaluation. Here a semi-logarithmic plot of In # versus 1IS gives the value of
Ke directly from the slope (-Ke) and the maximum growth rate from the
intercept (ln #m). In the semi-logarithm plot, the logarithm of the values dampens the effect of noise in the data. Whereas in the Lineweaver-Burke plot the
reciprocal magnifies this effect. The logarithm eliminates problems with order of
magnitude differences in experimental values as well. Above all, this structure
allows easy evaluation of the kinetic parameters. These properties of the exponential structure advantageous for describing spectinomycin biosynthesis and
identifying the process parameters where the observed trends are quite complex.
Coincidentally, the maximum of this function with respect to the substrate
concentration occurs at the same values as that for Haldane-Monod kinetics,
namely, S = ~
= x/(K~/Ki). Figure A.2 presents a comparison of the
Haldane-Monod and exponential inhibition kinetics for the same K,, and
K~ values. The magnitude of the function at the maximum is smaller for
the exponential structure because of the stronger influence of the inhibition
J. Gomes and A.S. Menawat
0.025
0.02
~ 0.015
o=
"~ 0.01
. ==
~ 0.005
t~
0
0.12
0.08
0.04 i
0
2
4
6
8
10
Glucose Concentration (g I q)
Fig. A.1. Variation of specific growth rate for Monod and exponential structures.
The exponential structure displays significant advantages over the Monod
structure in evaluating parameters from experimental data. Obtaining kinetic
parameters from experimental data with Monod equation accompanies error.
For example, points least accurately measured and furthest from the origin
dominate the slope of the Lineweaver-Burke plot (1//~ versus l/S). Accurately
measured values are clustered near the origin and contribute less towards the
slope of the curve. The exponential structure removes this problem in parameter
evaluation. Here a semi-logarithmic plot of In # versus 1IS gives the value of
Ke directly from the slope (-Ke) and the maximum growth rate from the
intercept (ln #m). In the semi-logarithm plot, the logarithm of the values dampens the effect of noise in the data. Whereas in the Lineweaver-Burke plot the
reciprocal magnifies this effect. The logarithm eliminates problems with order of
magnitude differences in experimental values as well. Above all, this structure
allows easy evaluation of the kinetic parameters. These properties of the exponential structure advantageous for describing spectinomycin biosynthesis and
identifying the process parameters where the observed trends are quite complex.
Coincidentally, the maximum of this function with respect to the substrate
concentration occurs at the same values as that for Haldane-Monod kinetics,
namely, S = ~
= x/(K~/Ki). Figure A.2 presents a comparison of the
Haldane-Monod and exponential inhibition kinetics for the same K,, and
K~ values. The magnitude of the function at the maximum is smaller for
the exponential structure because of the stronger influence of the inhibition