

38
400
J. Gomes and A.S. Menawat
i 300
loo
24
48
72
96
120
Time (h)
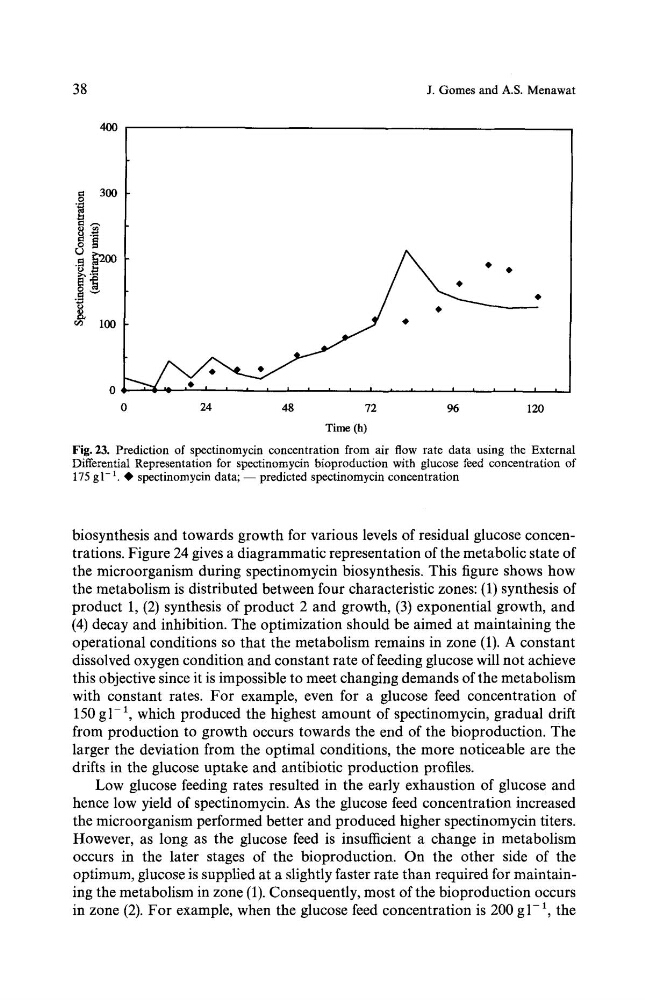
Fig. 23. Prediction of spectinomycin concentration from air flow rate data using the External
Differential Representation for spectinomycin bioproduction with glucose feed concentration of
175 g I-1. 9 spectinomycin data; -- predicted spectinomycin concentration
biosynthesis and towards growth for various levels of residual glucose concentrations. Figure 24 gives a diagrammatic representation of the metabolic state of
the microorganism during spectinomycin biosynthesis. This figure shows how
the metabolism is distributed between four characteristic zones: (1) synthesis of
product 1, (2) synthesis of product 2 and growth, (3) exponential growth, and
(4) decay and inhibition. The optimization should be aimed at maintaining the
operational conditions so that the metabolism remains in zone (1). A constant
dissolved oxygen condition and constant rate of feeding glucose will not achieve
this objective since it is impossible to meet changing demands of the metabolism
with constant rates. For example, even for a glucose feed concentration of
150 g 1-1, which produced the highest amount of spectinomycin, gradual drift
from production to growth occurs towards the end of the bioproduction. The
larger the deviation from the optimal conditions, the more noticeable are the
drifts in the glucose uptake and antibiotic production profiles.
Low glucose feeding rates resulted in the early exhaustion of glucose and
hence low yield of spectinomycin. As the glucose feed concentration increased
the microorganism performed better and produced higher spectinomycin titers.
However, as long as the glucose feed is insufficient a change in metabolism
occurs in the later stages of the bioproduction. On the other side of the
optimum, glucose is supplied at a slightly faster rate than required for maintaining the metabolism in zone (1). Consequently, most of the bioproduction occurs
in zone (2). For example, when the glucose feed concentration is 200 g 1-1, the
400
J. Gomes and A.S. Menawat
i 300
loo
24
48
72
96
120
Time (h)
Fig. 23. Prediction of spectinomycin concentration from air flow rate data using the External
Differential Representation for spectinomycin bioproduction with glucose feed concentration of
175 g I-1. 9 spectinomycin data; -- predicted spectinomycin concentration
biosynthesis and towards growth for various levels of residual glucose concentrations. Figure 24 gives a diagrammatic representation of the metabolic state of
the microorganism during spectinomycin biosynthesis. This figure shows how
the metabolism is distributed between four characteristic zones: (1) synthesis of
product 1, (2) synthesis of product 2 and growth, (3) exponential growth, and
(4) decay and inhibition. The optimization should be aimed at maintaining the
operational conditions so that the metabolism remains in zone (1). A constant
dissolved oxygen condition and constant rate of feeding glucose will not achieve
this objective since it is impossible to meet changing demands of the metabolism
with constant rates. For example, even for a glucose feed concentration of
150 g 1-1, which produced the highest amount of spectinomycin, gradual drift
from production to growth occurs towards the end of the bioproduction. The
larger the deviation from the optimal conditions, the more noticeable are the
drifts in the glucose uptake and antibiotic production profiles.
Low glucose feeding rates resulted in the early exhaustion of glucose and
hence low yield of spectinomycin. As the glucose feed concentration increased
the microorganism performed better and produced higher spectinomycin titers.
However, as long as the glucose feed is insufficient a change in metabolism
occurs in the later stages of the bioproduction. On the other side of the
optimum, glucose is supplied at a slightly faster rate than required for maintaining the metabolism in zone (1). Consequently, most of the bioproduction occurs
in zone (2). For example, when the glucose feed concentration is 200 g 1-1, the