

A magnetically adapted ADSEP was used to reduce the above principle to
practice. Using large (1–2-mm) paramagnetic beads from Polysciences, Inc.
(Warrington, PA, cat. no. 19131), a series of cylindrical magnets of increasing
strength with increasing cavity number was positioned above six consecutive
cavities of the ADSEP upper plate in the programmable ADSEP base device.
These commercial particles have a broad distribution in size and susceptibility
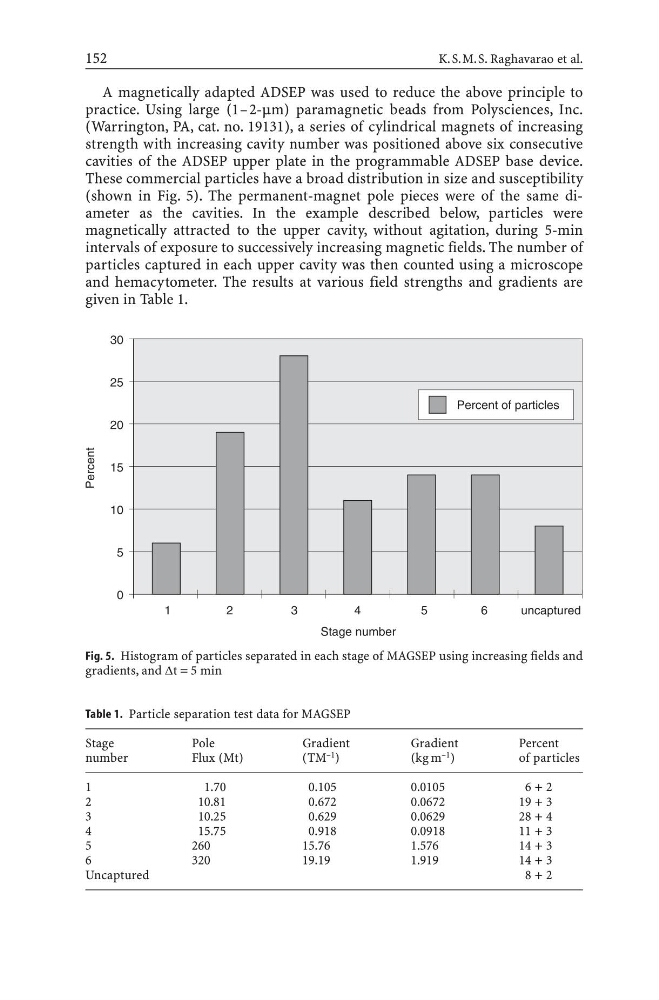
(shown in Fig. 5). The permanent-magnet pole pieces were of the same diameter as the cavities. In the example described below, particles were
magnetically attracted to the upper cavity, without agitation, during 5-min
intervals of exposure to successively increasing magnetic fields. The number of
particles captured in each upper cavity was then counted using a microscope
and hemacytometer. The results at various field strengths and gradients are
given in Table 1.
152
K.S.M.S. Raghavarao et al.
Fig. 5. Histogram of particles separated in each stage of MAGSEP using increasing fields and
gradients, and Dt = 5 min
Table 1. Particle separation test data for MAGSEP
Stage
Pole
Gradient
Gradient
Percent
number
Flux (Mt)
(TM
–1 )
(kg m –1 )
of particles
1
1.70
0.105
0.0105
6 + 2
2
10.81
0.672
0.0672
19 + 3
3
10.25
0.629
0.0629
28 + 4
4
15.75
0.918
0.0918
11 + 3
5
260
15.76
1.576
14 + 3
6
320
19.19
1.919
14 + 3
Uncaptured
8 + 2
practice. Using large (1–2-mm) paramagnetic beads from Polysciences, Inc.
(Warrington, PA, cat. no. 19131), a series of cylindrical magnets of increasing
strength with increasing cavity number was positioned above six consecutive
cavities of the ADSEP upper plate in the programmable ADSEP base device.
These commercial particles have a broad distribution in size and susceptibility
(shown in Fig. 5). The permanent-magnet pole pieces were of the same diameter as the cavities. In the example described below, particles were
magnetically attracted to the upper cavity, without agitation, during 5-min
intervals of exposure to successively increasing magnetic fields. The number of
particles captured in each upper cavity was then counted using a microscope
and hemacytometer. The results at various field strengths and gradients are
given in Table 1.
152
K.S.M.S. Raghavarao et al.
Fig. 5. Histogram of particles separated in each stage of MAGSEP using increasing fields and
gradients, and Dt = 5 min
Table 1. Particle separation test data for MAGSEP
Stage
Pole
Gradient
Gradient
Percent
number
Flux (Mt)
(TM
–1 )
(kg m –1 )
of particles
1
1.70
0.105
0.0105
6 + 2
2
10.81
0.672
0.0672
19 + 3
3
10.25
0.629
0.0629
28 + 4
4
15.75
0.918
0.0918
11 + 3
5
260
15.76
1.576
14 + 3
6
320
19.19
1.919
14 + 3
Uncaptured
8 + 2