

70
M. WILM et al.
A
B
100
80
5
60
4
40
3
~
2
20
" 0
" c
1170
0
~
1180
1290
~
y 12
c
C
!
D
]
y 13
6
!
20
5
15
4
10
3
2
1170
1300
m/z,amu
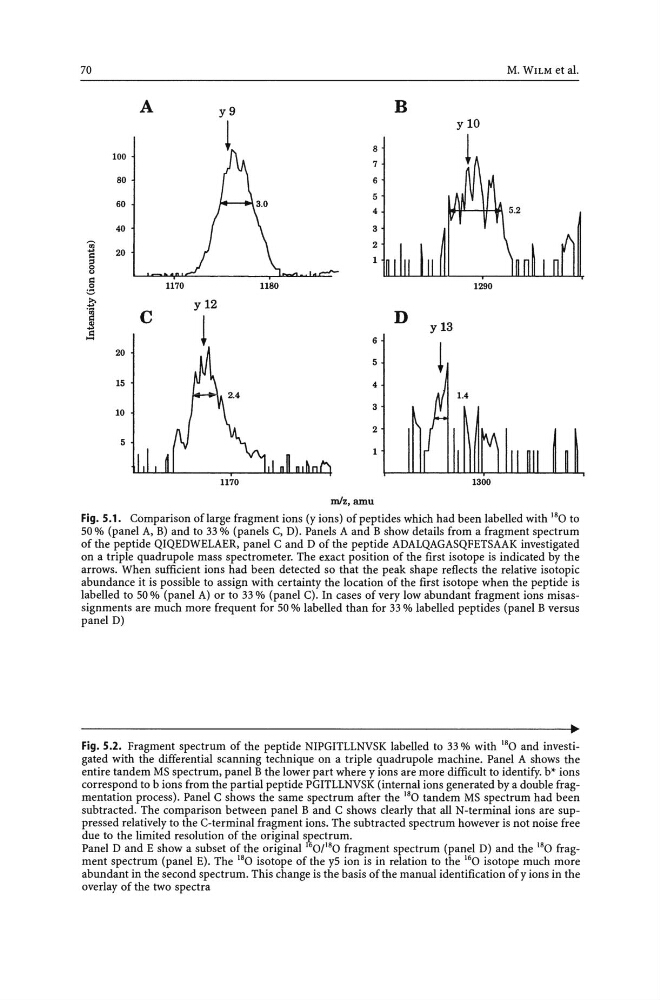
Fig. 5.1. Comparison oflarge fragment ions (y ions) of peptides which had been labelled with 18 0 to
50 % (panel A, B) and to 33 % (panels C, D). Panels A and B show details from a fragment spectrum
of the peptide QIQEDWELAER, panel C and D of the peptide ADALQAGASQFETSAAK investigated
on a triple quadrupole mass spectrometer. The exact position of the first isotope is indicated by the
arrows. When sufficient ions had been detected so that the peak shape reflects the relative isotopic
abundance it is possible to assign with certainty the location of the first isotope when the peptide is
labelled to 50 % (panel A) or to 33 % (panel C). In cases of very low abundant fragment ions misassignments are much more frequent for 50 % labelled than for 33 % labelled peptides (panel B versus
panel D)
Fig. 5.2. Fragment spectrum of the peptide NIPGITLLNVSK labelled to 33 % with 18 0 and investigated with the differential scanning technique on a triple quadrupole machine. Panel A shows the
entire tandem MS spectrum, panel B the lower part where y ions are more difficult to identify. b* ions
correspond to b ions from the partial peptide PGITLLNVSK (internal ions generated by a double fragmentation process). Panel C shows the same spectrum after the 18 0 tandem MS spectrum had been
subtracted. The comparison between panel Band C shows clearly that all N-terminal ions are suppressed relatively to the C-terminal fragment ions. The subtracted spectrum however is not noise free
due to the limited resolution of the original sRectrum.
Panel D and E show a subset of the original 0/ 18 0 fragment spectrum (panel D) and the 18 0 fragment spectrum (panel E). The 18 0 isotope of the y5 ion is in relation to the 16 0 isotope much more
abundant in the second spectrum. This change is the basis of the manual identification of y ions in the
overlay of the two spectra
M. WILM et al.
A
B
100
80
5
60
4
40
3
~
2
20
" 0
" c
1170
0
~
1180
1290
~
y 12
c
C
!
D
]
y 13
6
!
20
5
15
4
10
3
2
1170
1300
m/z,amu
Fig. 5.1. Comparison oflarge fragment ions (y ions) of peptides which had been labelled with 18 0 to
50 % (panel A, B) and to 33 % (panels C, D). Panels A and B show details from a fragment spectrum
of the peptide QIQEDWELAER, panel C and D of the peptide ADALQAGASQFETSAAK investigated
on a triple quadrupole mass spectrometer. The exact position of the first isotope is indicated by the
arrows. When sufficient ions had been detected so that the peak shape reflects the relative isotopic
abundance it is possible to assign with certainty the location of the first isotope when the peptide is
labelled to 50 % (panel A) or to 33 % (panel C). In cases of very low abundant fragment ions misassignments are much more frequent for 50 % labelled than for 33 % labelled peptides (panel B versus
panel D)
Fig. 5.2. Fragment spectrum of the peptide NIPGITLLNVSK labelled to 33 % with 18 0 and investigated with the differential scanning technique on a triple quadrupole machine. Panel A shows the
entire tandem MS spectrum, panel B the lower part where y ions are more difficult to identify. b* ions
correspond to b ions from the partial peptide PGITLLNVSK (internal ions generated by a double fragmentation process). Panel C shows the same spectrum after the 18 0 tandem MS spectrum had been
subtracted. The comparison between panel Band C shows clearly that all N-terminal ions are suppressed relatively to the C-terminal fragment ions. The subtracted spectrum however is not noise free
due to the limited resolution of the original sRectrum.
Panel D and E show a subset of the original 0/ 18 0 fragment spectrum (panel D) and the 18 0 fragment spectrum (panel E). The 18 0 isotope of the y5 ion is in relation to the 16 0 isotope much more
abundant in the second spectrum. This change is the basis of the manual identification of y ions in the
overlay of the two spectra