

44
L. CASTELLANOS-SERRA et al.
3
Applications to Proteome Analysis by Mass Spectrometry
Identification and characterization of proteins isolated from natural sources by
polyacrylamide gel electrophoresis has become a routine technique. However,
many problems with efficient sample proteolysis and subsequent peptide extraction still plague the researcher during the analysis. By combining the high sensitivity in detection, a fully reversible protein fixation, and high elution yields from
gel microparticles, the present method for micro digestion has proved to significantly improve the efficiency of digestion and peptide recovery, allowing confident protein identification when followed by peptide analysis by capillary-HPLCtandem-MS and MALDI-TOF MS.
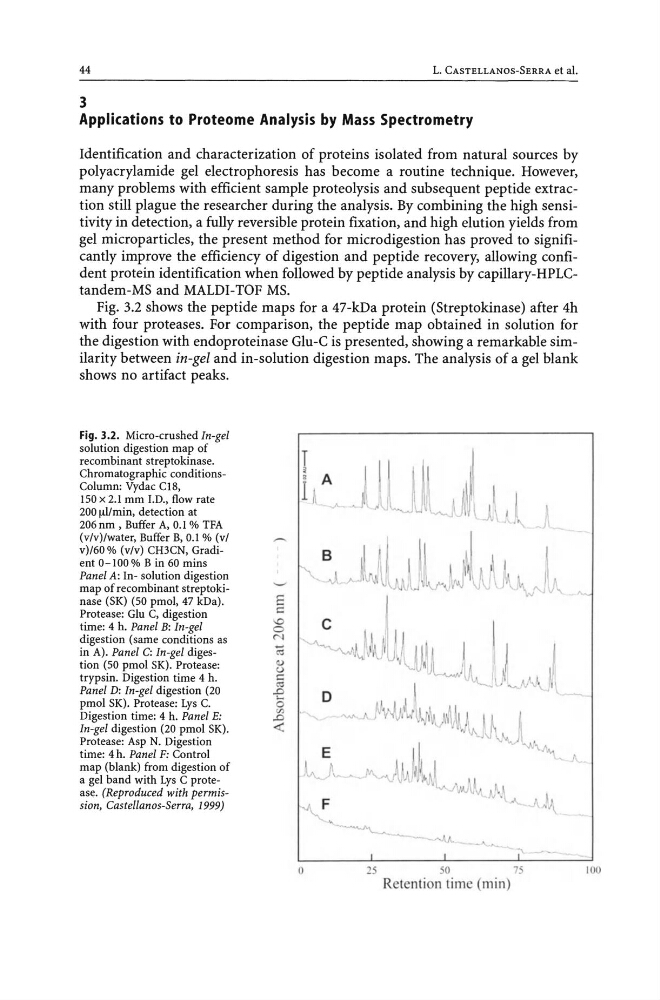
Fig. 3.2 shows the peptide maps for a 47-kDa protein (Streptokinase) after 4h
with four proteases. For comparison, the peptide map obtained in solution for
the digestion with endoproteinase Glu-C is presented, showing a remarkable similarity between in-gel and in-solution digestion maps. The analysis of a gel blank
shows no artifact peaks.
Fig. 3.2. Micro-crushed In-gel
solution digestion map of
recombinant streptokinase.
Chromatographic conditionsColumn: Vydac CIS,
ISO x 2.1 mm I.D., flow rate
200 f!l!min, detection at
206nm, Buffer A, 0.1 % TFA
(vlv)/water, Buffer B, 0.1 % (vi
v)/60 % (vlv) CH3CN, Gradient 0-100 % B in 60 mins
Panel A: In- solution digestion
map of recombinant streptokinase (SK) (50 pmol, 47 kDa).
Protease: Glu C, digestion
time: 4 h. Panel B: In-gel
digestion (same conditions as
in A). Panel C: In-gel digestion (50 pmol SK). Protease:
trypsin. Digestion time 4 h.
Panel D: In-gel digestion (20
pmol SK). Protease: Lys C.
Digestion time: 4 h. Panel E:
In-gel digestion (20 pmol SK).
Protease: Asp N. Digestion
time: 4 h. Panel F: Control
map (blank) from digestion of
a gel band with Lys C proteaSe. (Reproduced with permission, Castellanos-Serra, 1999)
",-F
o
c }JV",1/.; 1":1 \~ I;IU 1
J ".~
~).~. ~ v J l I I
~ J\'IJV
25
50
75
Retention time (min)
IUO
L. CASTELLANOS-SERRA et al.
3
Applications to Proteome Analysis by Mass Spectrometry
Identification and characterization of proteins isolated from natural sources by
polyacrylamide gel electrophoresis has become a routine technique. However,
many problems with efficient sample proteolysis and subsequent peptide extraction still plague the researcher during the analysis. By combining the high sensitivity in detection, a fully reversible protein fixation, and high elution yields from
gel microparticles, the present method for micro digestion has proved to significantly improve the efficiency of digestion and peptide recovery, allowing confident protein identification when followed by peptide analysis by capillary-HPLCtandem-MS and MALDI-TOF MS.
Fig. 3.2 shows the peptide maps for a 47-kDa protein (Streptokinase) after 4h
with four proteases. For comparison, the peptide map obtained in solution for
the digestion with endoproteinase Glu-C is presented, showing a remarkable similarity between in-gel and in-solution digestion maps. The analysis of a gel blank
shows no artifact peaks.
Fig. 3.2. Micro-crushed In-gel
solution digestion map of
recombinant streptokinase.
Chromatographic conditionsColumn: Vydac CIS,
ISO x 2.1 mm I.D., flow rate
200 f!l!min, detection at
206nm, Buffer A, 0.1 % TFA
(vlv)/water, Buffer B, 0.1 % (vi
v)/60 % (vlv) CH3CN, Gradient 0-100 % B in 60 mins
Panel A: In- solution digestion
map of recombinant streptokinase (SK) (50 pmol, 47 kDa).
Protease: Glu C, digestion
time: 4 h. Panel B: In-gel
digestion (same conditions as
in A). Panel C: In-gel digestion (50 pmol SK). Protease:
trypsin. Digestion time 4 h.
Panel D: In-gel digestion (20
pmol SK). Protease: Lys C.
Digestion time: 4 h. Panel E:
In-gel digestion (20 pmol SK).
Protease: Asp N. Digestion
time: 4 h. Panel F: Control
map (blank) from digestion of
a gel band with Lys C proteaSe. (Reproduced with permission, Castellanos-Serra, 1999)
",-F
o
c }JV",1/.; 1":1 \~ I;IU 1
J ".~
~).~. ~ v J l I I
~ J\'IJV
25
50
75
Retention time (min)
IUO