

Structure, Dynamics and Function of the Proton Pump Bacteriorhodopsin
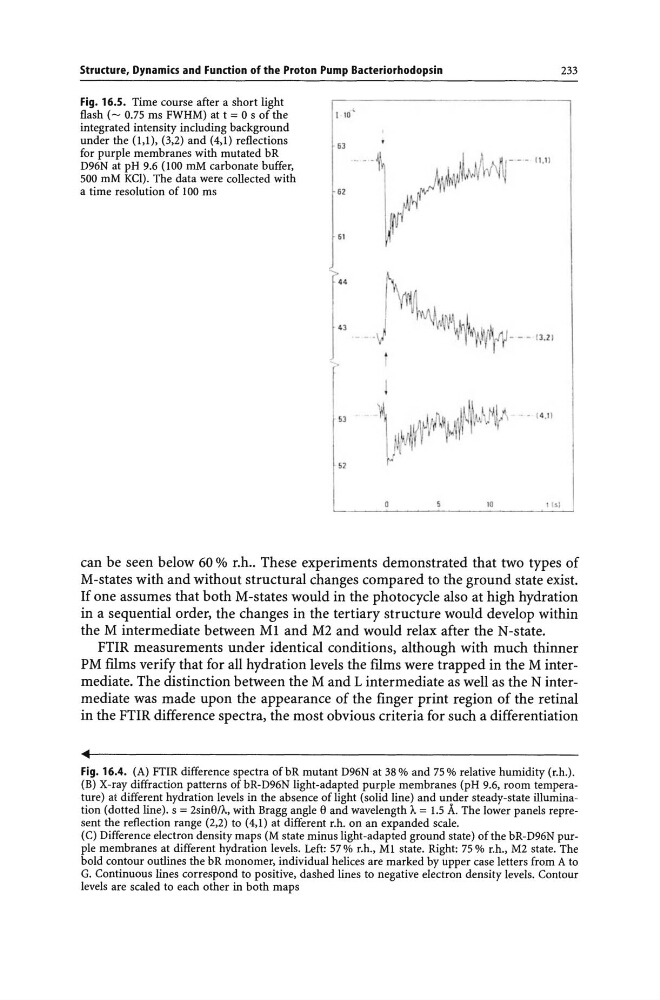
Fig. 16.5. Time course after a short light
flash (- 0.75 ms FWHM) at t = 0 s of the
integrated intensity including background
under the (1,1), (3,2) and (4,1) reflections
for purple membranes with mutated bR
D96N at pH 9.6 (100 mM carbonate buffer,
500 mM KCI). The data were collected with
a time resolution of 100 ms
I 10 ~
63
. - - I
II
62
61
r
43
S)
S2
)I¥I, ~J~
ft
r
~W- ~
I IN ~!VI
10
233
- - - 11.11
---1 3.2 1
can be seen below 60 % r.h .. These experiments demonstrated that two types of
M-states with and without structural changes compared to the ground state exist.
If one assumes that both M-states would in the photocycle also at high hydration
in a sequential order, the changes in the tertiary structure would develop within
the M intermediate between Ml and M2 and would relax after the N-state.
FTIR measurements under identical conditions, although with much thinner
PM fIlms verify that for all hydration levels the films were trapped in the M intermediate. The distinction between the M and L intermediate as well as the N intermediate was made upon the appearance of the fInger print region of the retinal
in the FTIR difference spectra, the most obvious criteria for such a differentiation
Fig. 16.4. (A) FTIR difference spectra of bR mutant D96N at 38 % and 75 % relative humidity (r.h.).
(B) X-ray diffraction patterns ofbR-D96N light-adapted purple membranes (pH 9.6, room temperature) at different hydration levels in the absence of light (solid line) and under steady-state illumination (dotted line). s = 2sinll/l., with Bragg angle Il and wavelength I. = 1.5 A. The lower panels represent the reflection range (2,2) to (4,1) at different r.h. on an expanded scale.
(C) Difference electron density maps (M state minus light-adapted ground state) of the bR-D96N purple membranes at different hydration levels. Left: 57 % r.h., MI state. Right: 75 % r.h., M2 state. The
bold contour outlines the bR monomer, individual helices are marked by upper case letters from A to
G. Continuous lines correspond to positive, dashed lines to negative electron density levels. Contour
levels are scaled to each other in both maps
Fig. 16.5. Time course after a short light
flash (- 0.75 ms FWHM) at t = 0 s of the
integrated intensity including background
under the (1,1), (3,2) and (4,1) reflections
for purple membranes with mutated bR
D96N at pH 9.6 (100 mM carbonate buffer,
500 mM KCI). The data were collected with
a time resolution of 100 ms
I 10 ~
63
. - - I
II
62
61
r
43
S)
S2
)I¥I, ~J~
ft
r
~W- ~
I IN ~!VI
10
233
- - - 11.11
---1 3.2 1
can be seen below 60 % r.h .. These experiments demonstrated that two types of
M-states with and without structural changes compared to the ground state exist.
If one assumes that both M-states would in the photocycle also at high hydration
in a sequential order, the changes in the tertiary structure would develop within
the M intermediate between Ml and M2 and would relax after the N-state.
FTIR measurements under identical conditions, although with much thinner
PM fIlms verify that for all hydration levels the films were trapped in the M intermediate. The distinction between the M and L intermediate as well as the N intermediate was made upon the appearance of the fInger print region of the retinal
in the FTIR difference spectra, the most obvious criteria for such a differentiation
Fig. 16.4. (A) FTIR difference spectra of bR mutant D96N at 38 % and 75 % relative humidity (r.h.).
(B) X-ray diffraction patterns ofbR-D96N light-adapted purple membranes (pH 9.6, room temperature) at different hydration levels in the absence of light (solid line) and under steady-state illumination (dotted line). s = 2sinll/l., with Bragg angle Il and wavelength I. = 1.5 A. The lower panels represent the reflection range (2,2) to (4,1) at different r.h. on an expanded scale.
(C) Difference electron density maps (M state minus light-adapted ground state) of the bR-D96N purple membranes at different hydration levels. Left: 57 % r.h., MI state. Right: 75 % r.h., M2 state. The
bold contour outlines the bR monomer, individual helices are marked by upper case letters from A to
G. Continuous lines correspond to positive, dashed lines to negative electron density levels. Contour
levels are scaled to each other in both maps