

Strategies and Methods for Proteome Analysis
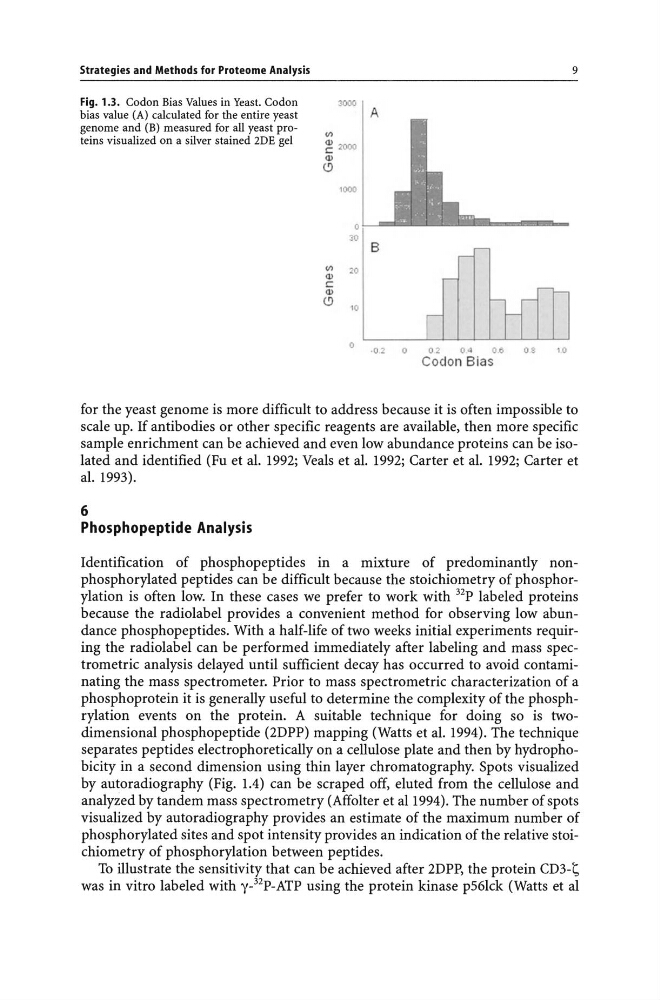
Fig. 1.3. Codon Bias Values in Yeast. Codon
bias value (A) calculated for the entire yeast
genome and (B) measured for all yeast proteins visualized on a silver stained 2DE gel
3000
(/)
~ 2000
<1>
<.9
1000
0
30
(/)
<1>
20
C
<1>
<.9 10
0
9
A
B
·02
0
02
o ~
0.6
0$
10
Coclon Bias
for the yeast genome is more difficult to address because it is often impossible to
scale up. If antibodies or other specific reagents are available, then more specific
sample enrichment can be achieved and even low abundance proteins can be isolated and identified (Fu et al. 1992; Veals et al. 1992; Carter et al. 1992; Carter et
al. 1993).
6
Phospho peptide Analysis
Identification of phosphopeptides in a mixture of predominantly nonphosphorylated peptides can be difficult because the stoichiometry of phosphorylation is often low. In these cases we prefer to work with 32p labeled proteins
because the radiolabel provides a convenient method for observing low abundance phosphopeptides. With a half-life of two weeks initial experiments requiring the radiolabel can be performed immediately after labeling and mass spectrometric analysis delayed until sufficient decay has occurred to avoid contaminating the mass spectrometer. Prior to mass spectrometric characterization of a
phosphoprotein it is generally useful to determine the complexity of the phosphrylation events on the protein. A suitable technique for doing so is twodimensional phosphopeptide (2DPP) mapping (Watts et al. 1994). The technique
separates peptides electrophoretically on a cellulose plate and then by hydrophobicity in a second dimension using thin layer chromatography. Spots visualized
by autoradiography (Fig. 1.4) can be scraped off, eluted from the cellulose and
analyzed by tandem mass spectrometry (Affolter et aI1994). The number of spots
visualized by autoradiography provides an estimate of the maximum number of
phosphorylated sites and spot intensity provides an indication of the relative stoichiometry of phosphorylation between peptides.
To illustrate the sensitivity that can be achieved after 2DPP, the protein CD3-l;
was in vitro labeled with y_ 32 p_ATP using the protein kinase p56lck (Watts et al
Fig. 1.3. Codon Bias Values in Yeast. Codon
bias value (A) calculated for the entire yeast
genome and (B) measured for all yeast proteins visualized on a silver stained 2DE gel
3000
(/)
~ 2000
<1>
<.9
1000
0
30
(/)
<1>
20
C
<1>
<.9 10
0
9
A
B
·02
0
02
o ~
0.6
0$
10
Coclon Bias
for the yeast genome is more difficult to address because it is often impossible to
scale up. If antibodies or other specific reagents are available, then more specific
sample enrichment can be achieved and even low abundance proteins can be isolated and identified (Fu et al. 1992; Veals et al. 1992; Carter et al. 1992; Carter et
al. 1993).
6
Phospho peptide Analysis
Identification of phosphopeptides in a mixture of predominantly nonphosphorylated peptides can be difficult because the stoichiometry of phosphorylation is often low. In these cases we prefer to work with 32p labeled proteins
because the radiolabel provides a convenient method for observing low abundance phosphopeptides. With a half-life of two weeks initial experiments requiring the radiolabel can be performed immediately after labeling and mass spectrometric analysis delayed until sufficient decay has occurred to avoid contaminating the mass spectrometer. Prior to mass spectrometric characterization of a
phosphoprotein it is generally useful to determine the complexity of the phosphrylation events on the protein. A suitable technique for doing so is twodimensional phosphopeptide (2DPP) mapping (Watts et al. 1994). The technique
separates peptides electrophoretically on a cellulose plate and then by hydrophobicity in a second dimension using thin layer chromatography. Spots visualized
by autoradiography (Fig. 1.4) can be scraped off, eluted from the cellulose and
analyzed by tandem mass spectrometry (Affolter et aI1994). The number of spots
visualized by autoradiography provides an estimate of the maximum number of
phosphorylated sites and spot intensity provides an indication of the relative stoichiometry of phosphorylation between peptides.
To illustrate the sensitivity that can be achieved after 2DPP, the protein CD3-l;
was in vitro labeled with y_ 32 p_ATP using the protein kinase p56lck (Watts et al