

The Folding Pathway of Disulfide Containing Proteins
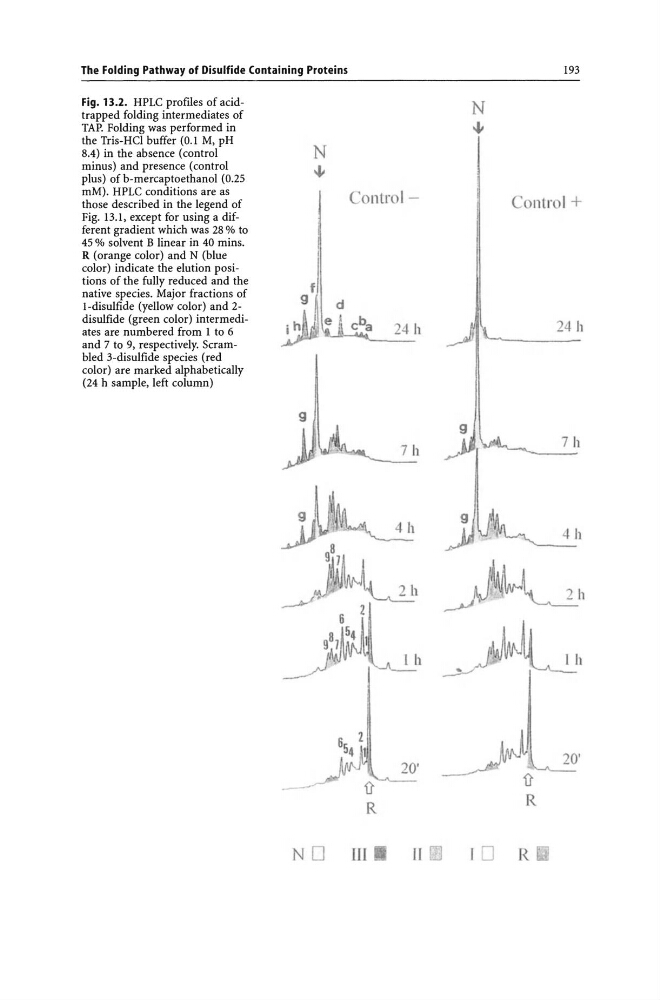
Fig. 13.2. HPLC profiles of acidtrapped folding intermediates of
TAP. Folding was performed in
the Tris-HCI buffer (0.1 M, pH
8.4) in the absence (control
minus) and presence (control
plus) ofb-mercaptoethanol (0.25
mM). HPLC conditions are as
those described in the legend of
Fig. 13.1, except for using a different gradient which was 28 % to
45 % solvent B linear in 40 mins.
R (orange color) and N (blue
color) indicate the elution positions of the fully reduced and the
native species. Major fractions of
I-disulfide (yellow color) and 2disulfide (green color) intermediates are numbered from 1 to 6
and 7 to 9, respectively. Scrambled 3-disulfide species (red
color) are marked alphabetically
(24 h sample, left column)
N
""
f
9
9
N O
d
Conlrol -
!Jl
II ~
9
N
""
10
193
ContI" I +
24 h
20'
R
Fig. 13.2. HPLC profiles of acidtrapped folding intermediates of
TAP. Folding was performed in
the Tris-HCI buffer (0.1 M, pH
8.4) in the absence (control
minus) and presence (control
plus) ofb-mercaptoethanol (0.25
mM). HPLC conditions are as
those described in the legend of
Fig. 13.1, except for using a different gradient which was 28 % to
45 % solvent B linear in 40 mins.
R (orange color) and N (blue
color) indicate the elution positions of the fully reduced and the
native species. Major fractions of
I-disulfide (yellow color) and 2disulfide (green color) intermediates are numbered from 1 to 6
and 7 to 9, respectively. Scrambled 3-disulfide species (red
color) are marked alphabetically
(24 h sample, left column)
N
""
f
9
9
N O
d
Conlrol -
!Jl
II ~
9
N
""
10
193
ContI" I +
24 h
20'
R