

144
E. LEHMANN and R. ZENOBI
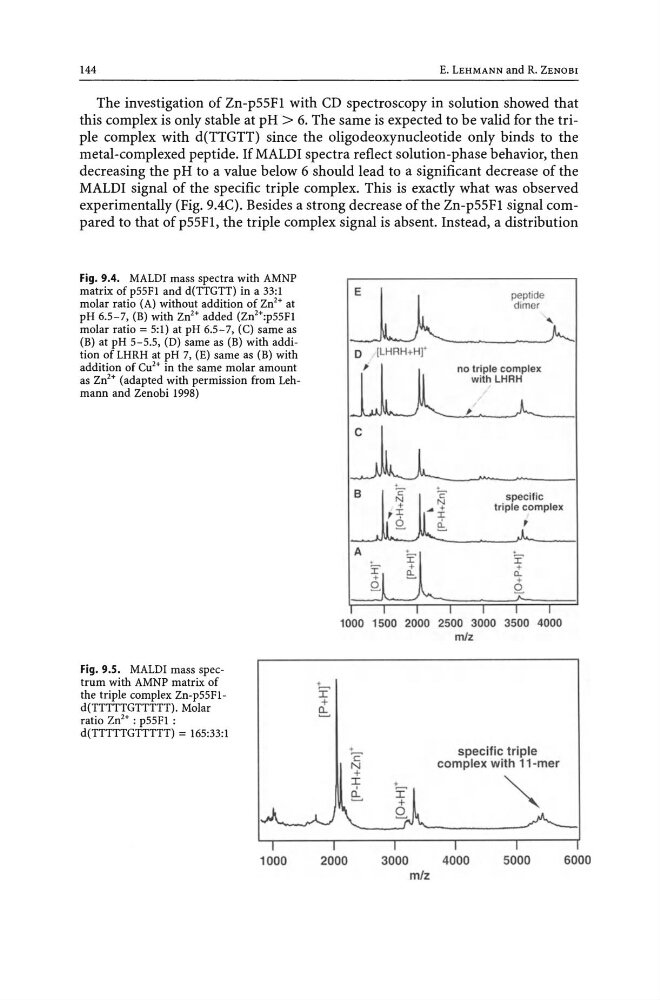
The investigation of Zn-p55Fl with CD spectroscopy in solution showed that
this complex is only stable at pH > 6. The same is expected to be valid for the triple complex with d(TTGTT) since the oligodeoxynucleotide only binds to the
metal-complexed peptide. If MALDI spectra reflect solution-phase behavior, then
decreasing the pH to a value below 6 should lead to a significant decrease of the
MALDI signal of the specific triple complex. This is exactly what was observed
experimentally (Fig. 9.4C). Besides a strong decrease of the Zn-p55Fl signal compared to that of p55Fl, the triple complex signal is absent. Instead, a distribution
Fig. 9.4. MALDI mass spectra with AMNP
matrix of p55F1 and d(TTGTT) in a 33:1
molar ratio (A) without addition of Zn'+ at
pH 6.5-7, (B) with Zn2+ added (Zn'+:p55F1
molar ratio = 5:1) at pH 6.5-7, (C) same as
(B) at pH 5-5.5, (D) same as (B) with addition of LHRH at pH 7, (E) same as (B) with
addition of Cu'+ in the same molar amount
as Zn'+ (adapted with permission from lehmann and Zenobi 1998)
Fig. 9.5. MALDI mass spectrum with AMNP matrix of
the triple complex Zn-p55F1d(TTTTTGTTTTT). Molar
ratio Zn'+ : p55F1 :
d(TTTTTGTTTTT) = 165:33:1
1000
o [LHRH+ HI'
B
A
1000 1500 2000
.
I
+
Q:.
+
C
N
+
I
e:.
2000
3000
m/z
peptide
dimer
no trip le complex
with LHRH
specific
triple complex
2500 3000 3500 4000
m/z
specific triple
complex with 11-mer
~
4000
5000
6000
E. LEHMANN and R. ZENOBI
The investigation of Zn-p55Fl with CD spectroscopy in solution showed that
this complex is only stable at pH > 6. The same is expected to be valid for the triple complex with d(TTGTT) since the oligodeoxynucleotide only binds to the
metal-complexed peptide. If MALDI spectra reflect solution-phase behavior, then
decreasing the pH to a value below 6 should lead to a significant decrease of the
MALDI signal of the specific triple complex. This is exactly what was observed
experimentally (Fig. 9.4C). Besides a strong decrease of the Zn-p55Fl signal compared to that of p55Fl, the triple complex signal is absent. Instead, a distribution
Fig. 9.4. MALDI mass spectra with AMNP
matrix of p55F1 and d(TTGTT) in a 33:1
molar ratio (A) without addition of Zn'+ at
pH 6.5-7, (B) with Zn2+ added (Zn'+:p55F1
molar ratio = 5:1) at pH 6.5-7, (C) same as
(B) at pH 5-5.5, (D) same as (B) with addition of LHRH at pH 7, (E) same as (B) with
addition of Cu'+ in the same molar amount
as Zn'+ (adapted with permission from lehmann and Zenobi 1998)
Fig. 9.5. MALDI mass spectrum with AMNP matrix of
the triple complex Zn-p55F1d(TTTTTGTTTTT). Molar
ratio Zn'+ : p55F1 :
d(TTTTTGTTTTT) = 165:33:1
1000
o [LHRH+ HI'
B
A
1000 1500 2000
.
I
+
Q:.
+
C
N
+
I
e:.
2000
3000
m/z
peptide
dimer
no trip le complex
with LHRH
specific
triple complex
2500 3000 3500 4000
m/z
specific triple
complex with 11-mer
~
4000
5000
6000