

Computer Analysis of Oscillatory Features of the Red Cell System
231
Discussion of the Mathematical Formulation
It has been shown in figure 2(c), in comparison with the experimental
data of ORR et al. [2], that uniform continued oscillations are generated
from the interactions between the natural frequencies of the loops. An
important feature of the formulation is shown in the period of entrainment
of the frequencies during the first 80 days, leading to the final uniform
oscillations, in phase. Oscillations of this type only occur for small differences in frequency between the loops. The entrainment of one frequency
with a natural reference frequency is well recognised in the synchronisation
220 r
200r
180~
I
160 L
F 140t
c 120
~
I
Q;
,
0.. 100
II
I
t l~'
I
80
\ I \ I
r
I / \ I \
I I
I I \
I
60 I I I I
I
,I
U
I
I
\
I
,I
\
I
.
40
20,
i
o '-----L-_~ __ ~
-
I
/
I
I
-
II
I I
I I ,
I
1/ I
/
• I
I
\
I
I'
I
I
I
/
/
I
I
/
I
I
/
I
I \
I
I
\ rl I
\
I
I
I
I I I I r ,
II/
/ \
I I
\
\ I
\
I
,
, I
, I I
I
•
o 20 40 60 80 100 120 140 160 180 200 220 240 260 280 300
Days
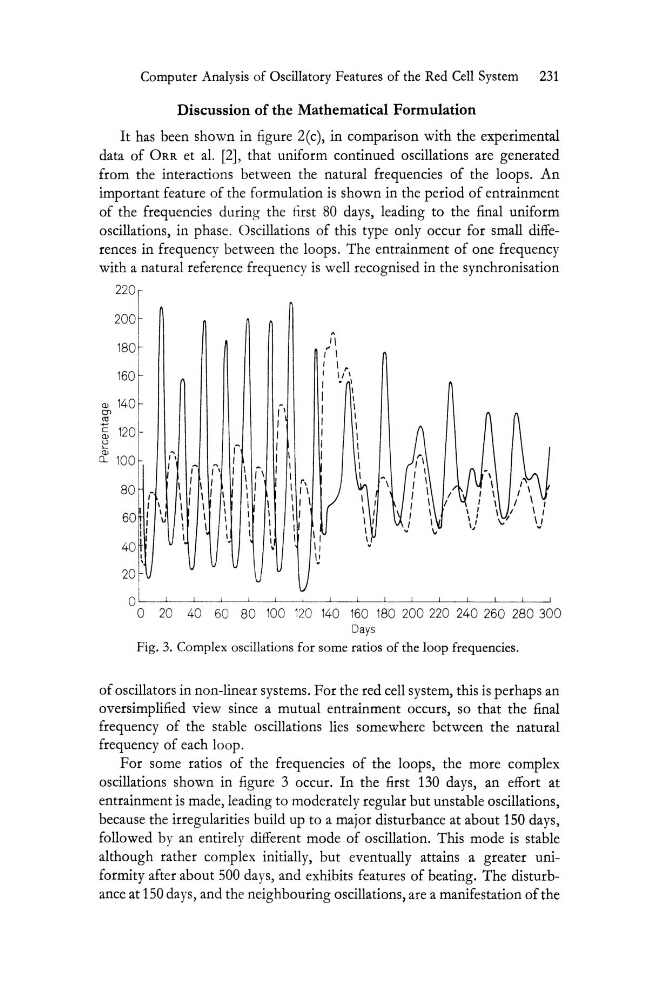
Fig. 3. Complex oscillations for some ratios of the loop frequencies.
of oscillators in non-linear systems. For the red cell system, this is perhaps an
oversimplified view since a mutual entrainment occurs, so that the final
frequency of the stable oscillations lies somewhere between the natural
frequency of each loop.
For some ratios of the frequencies of the loops, the more complex
oscillations shown in figure 3 occur. In the first 130 days, an effort at
entrainment is made, leading to moderately regular but unstable oscillations,
because the irregularities build up to a major disturbance at about 150 days,
followed by an entirely different mode of oscillation. This mode is stable
although rather complex initially, but eventually attains a greater uniformity after about 500 days, and exhibits features of beating. The disturbance at 150 days, and the neighbouring oscillations, are a manifestation of the
231
Discussion of the Mathematical Formulation
It has been shown in figure 2(c), in comparison with the experimental
data of ORR et al. [2], that uniform continued oscillations are generated
from the interactions between the natural frequencies of the loops. An
important feature of the formulation is shown in the period of entrainment
of the frequencies during the first 80 days, leading to the final uniform
oscillations, in phase. Oscillations of this type only occur for small differences in frequency between the loops. The entrainment of one frequency
with a natural reference frequency is well recognised in the synchronisation
220 r
200r
180~
I
160 L
F 140t
c 120
~
I
Q;
,
0.. 100
II
I
t l~'
I
80
\ I \ I
r
I / \ I \
I I
I I \
I
60 I I I I
I
,I
U
I
I
\
I
,I
\
I
.
40
20,
i
o '-----L-_~ __ ~
-
I
/
I
I
-
II
I I
I I ,
I
1/ I
/
• I
I
\
I
I'
I
I
I
/
/
I
I
/
I
I
/
I
I \
I
I
\ rl I
\
I
I
I
I I I I r ,
II/
/ \
I I
\
\ I
\
I
,
, I
, I I
I
•
o 20 40 60 80 100 120 140 160 180 200 220 240 260 280 300
Days
Fig. 3. Complex oscillations for some ratios of the loop frequencies.
of oscillators in non-linear systems. For the red cell system, this is perhaps an
oversimplified view since a mutual entrainment occurs, so that the final
frequency of the stable oscillations lies somewhere between the natural
frequency of each loop.
For some ratios of the frequencies of the loops, the more complex
oscillations shown in figure 3 occur. In the first 130 days, an effort at
entrainment is made, leading to moderately regular but unstable oscillations,
because the irregularities build up to a major disturbance at about 150 days,
followed by an entirely different mode of oscillation. This mode is stable
although rather complex initially, but eventually attains a greater uniformity after about 500 days, and exhibits features of beating. The disturbance at 150 days, and the neighbouring oscillations, are a manifestation of the