

220
L. E. COE, MARY H. COE, and IN-YOUNG LEE
case (a) D = 2.56 - 1.84 e- 2 . 301
(b) D = 0.36 e-1.801 + 0.37 (Do = 0.72)
(b / ) D = 1.4 e-1.801 + 0.37 (Do = 1.77)
(c) D = -1.22e- 2 1.51 + 1.50e-1.981 + 0.44
(d) D = 10 e- 2 .421 sin (0.665)t + 1.69
where t is in min, Dis fLmoles/ml cells and 51-53 are chosen empirically.
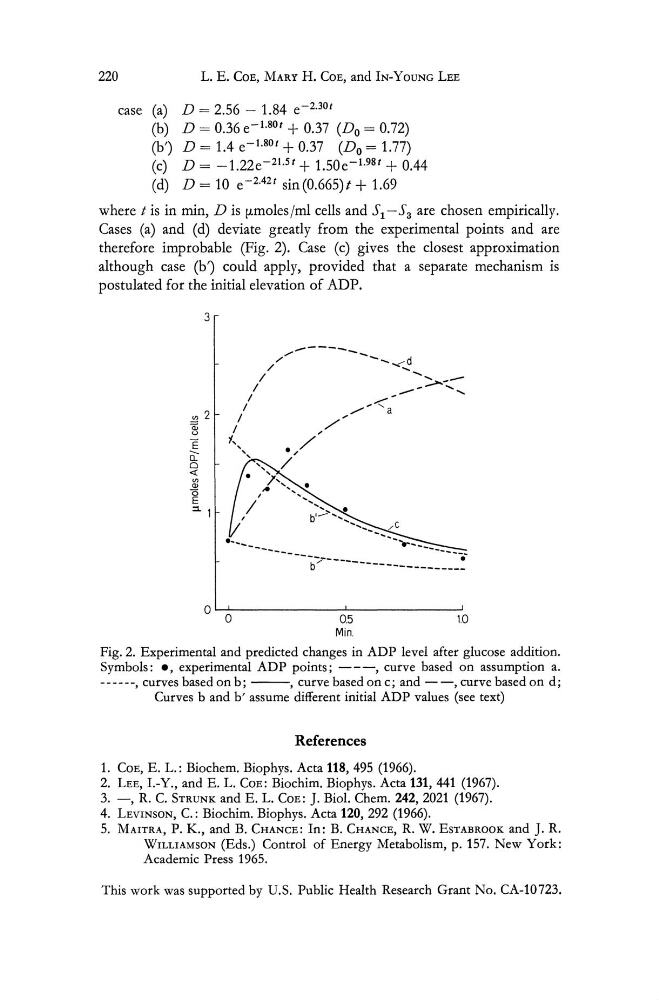
Cases (a) and (d) deviate greatly from the experimental points and are
therefore improbable (Fig. 2). Case (c) gives the closest approximation
although case (b / ) could apply, provided that a separate mechanism is
postulated for the initial elevation of ADP.
3
",..,.,.,------/ /
--. ...... .....;-~
/
..... ::::,.....-/
-- ..........
I
/
/
,/, ,
"
o 0
I
--.05
10
Min.
Fig. 2. Experimental and predicted changes in ADP level after glucose addition.
Symbols: ., experimental ADP points; - - - , curve based on assumption a.
------, curves based on b; - - , curve based on c; and - -, curve based on d;
Curves band b' assume different initial ADP values (see text)
References
1. COE, E. L.: Biochem. Biophys. Acta 118, 495 (1966).
2. LEE, I.-Y., and E. L. COE: Biochim. Biophys. Acta 131,441 (1967).
3. -, R. C. STRUNK and E. L. COE: J. BioI. Chern. 242, 2021 (1967).
4. LEVINSON, c.: Biochim. Biophys. Acta 120,292 (1966).
5. MAITRA, P. K., and B. CHANCE: In: B. CHANCE, R. W. ESTABROOK and J. R.
WILLIAMSON (Eds.) Control of Energy Metabolism, p. 157. New York:
Academic Press 1965.
This work was supported by U.S. Public Health Research Grant No. CA-10723.
L. E. COE, MARY H. COE, and IN-YOUNG LEE
case (a) D = 2.56 - 1.84 e- 2 . 301
(b) D = 0.36 e-1.801 + 0.37 (Do = 0.72)
(b / ) D = 1.4 e-1.801 + 0.37 (Do = 1.77)
(c) D = -1.22e- 2 1.51 + 1.50e-1.981 + 0.44
(d) D = 10 e- 2 .421 sin (0.665)t + 1.69
where t is in min, Dis fLmoles/ml cells and 51-53 are chosen empirically.
Cases (a) and (d) deviate greatly from the experimental points and are
therefore improbable (Fig. 2). Case (c) gives the closest approximation
although case (b / ) could apply, provided that a separate mechanism is
postulated for the initial elevation of ADP.
3
",..,.,.,------/ /
--. ...... .....;-~
/
..... ::::,.....-/
-- ..........
I
/
/
,/, ,
"
o 0
I
--.05
10
Min.
Fig. 2. Experimental and predicted changes in ADP level after glucose addition.
Symbols: ., experimental ADP points; - - - , curve based on assumption a.
------, curves based on b; - - , curve based on c; and - -, curve based on d;
Curves band b' assume different initial ADP values (see text)
References
1. COE, E. L.: Biochem. Biophys. Acta 118, 495 (1966).
2. LEE, I.-Y., and E. L. COE: Biochim. Biophys. Acta 131,441 (1967).
3. -, R. C. STRUNK and E. L. COE: J. BioI. Chern. 242, 2021 (1967).
4. LEVINSON, c.: Biochim. Biophys. Acta 120,292 (1966).
5. MAITRA, P. K., and B. CHANCE: In: B. CHANCE, R. W. ESTABROOK and J. R.
WILLIAMSON (Eds.) Control of Energy Metabolism, p. 157. New York:
Academic Press 1965.
This work was supported by U.S. Public Health Research Grant No. CA-10723.