

98
E. ZERBST
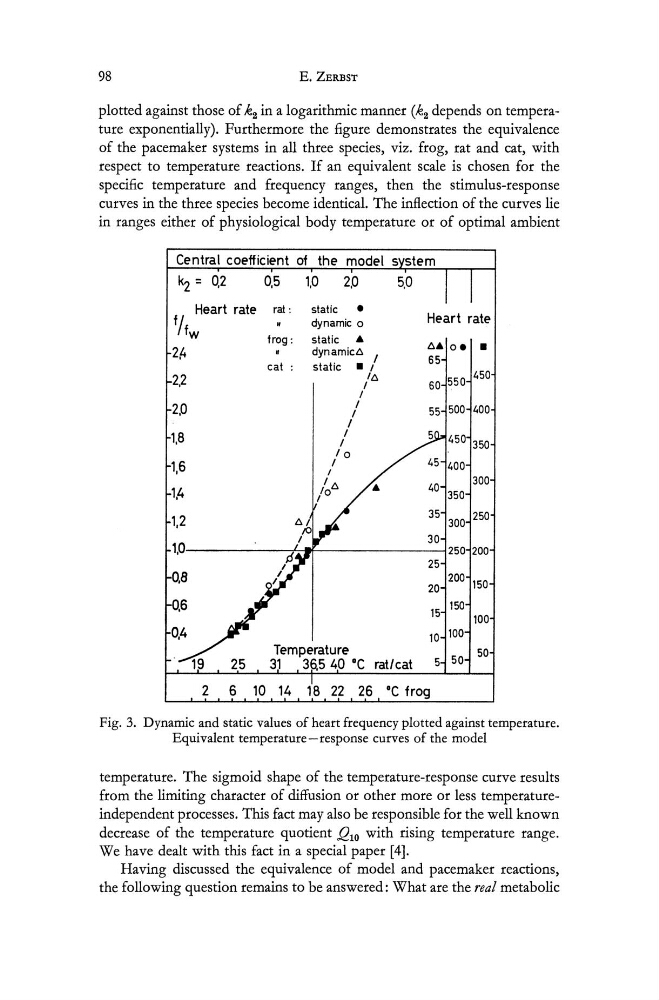
plotted against those of k2 in a logarithmic manner (k2 depends on temperature exponentially). Furthermore the figure demonstrates the equivalence
of the pacemaker systems in all three species, viz. frog, rat and cat, with
respect to temperature reactions. If an equivalent scale is chosen for the
specific temperature and frequency ranges, then the stimulus-response
curves in the three species become identical. The inflection of the curves lie
in ranges either of physiological body temperature or of optimal ambient
Central coefficient of the model
k2 = 0.2
0,5
1,0
2,0
Heart rate
f/fw
2f+
2,2
2,0
1,8
1,6
1,4
1,2
1.0
0,8
0,6
0,4
rat:
frog:
cat:
static
e
dynamic 0
static
•
dynamic6 I
static - I
/
/
/
I
/
/
/0
/
I
/
/0 6
I
16
/
Temperature
25
31
36,5 40 ·C rat/cat
Heart rate
6. oe
-
65
550
450
60
55 500 400
400
40
300
350
35
250
300
30 250 200
25
200 150
20
15
150
100
10 100
50
50
5
2 6 10 14 18 22 26 ·C frog
Fig. 3. Dynamic and static values of heart frequency plotted against temperature.
Equivalent temperature-response curves of the model
temperature. The sigmoid shape of the temperature-response curve results
from the limiting character of diffusion or other more or less temperatureindependent processes. This fact may also be responsible for the well known
decrease of the temperature quotient QI0 with rising temperature range.
We have dealt with this fact in a special paper [4].
Having discussed the equivalence of model and pacemaker reactions,
the following question remains to be answered: What are the real metabolic
E. ZERBST
plotted against those of k2 in a logarithmic manner (k2 depends on temperature exponentially). Furthermore the figure demonstrates the equivalence
of the pacemaker systems in all three species, viz. frog, rat and cat, with
respect to temperature reactions. If an equivalent scale is chosen for the
specific temperature and frequency ranges, then the stimulus-response
curves in the three species become identical. The inflection of the curves lie
in ranges either of physiological body temperature or of optimal ambient
Central coefficient of the model
k2 = 0.2
0,5
1,0
2,0
Heart rate
f/fw
2f+
2,2
2,0
1,8
1,6
1,4
1,2
1.0
0,8
0,6
0,4
rat:
frog:
cat:
static
e
dynamic 0
static
•
dynamic6 I
static - I
/
/
/
I
/
/
/0
/
I
/
/0 6
I
16
/
Temperature
25
31
36,5 40 ·C rat/cat
Heart rate
6. oe
-
65
550
450
60
55 500 400
400
40
300
350
35
250
300
30 250 200
25
200 150
20
15
150
100
10 100
50
50
5
2 6 10 14 18 22 26 ·C frog
Fig. 3. Dynamic and static values of heart frequency plotted against temperature.
Equivalent temperature-response curves of the model
temperature. The sigmoid shape of the temperature-response curve results
from the limiting character of diffusion or other more or less temperatureindependent processes. This fact may also be responsible for the well known
decrease of the temperature quotient QI0 with rising temperature range.
We have dealt with this fact in a special paper [4].
Having discussed the equivalence of model and pacemaker reactions,
the following question remains to be answered: What are the real metabolic