

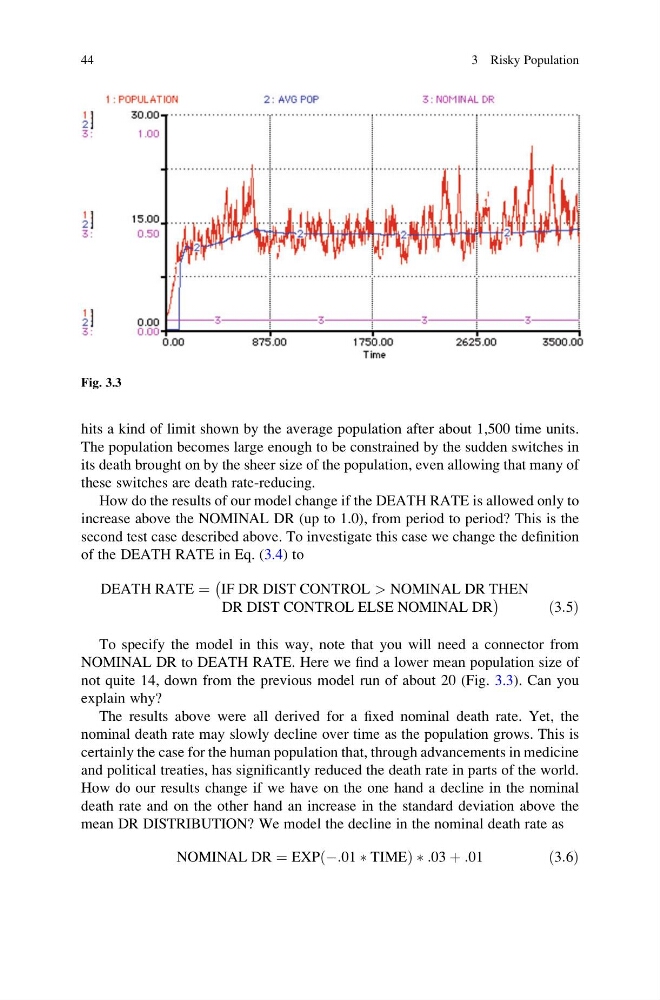
hits a kind of limit shown by the average population after about 1,500 time units.
The population becomes large enough to be constrained by the sudden switches in
its death brought on by the sheer size of the population, even allowing that many of
these switches are death rate-reducing.
How do the results of our model change if the DEATH RATE is allowed only to
increase above the NOMINAL DR (up to 1.0), from period to period? This is the
second test case described above. To investigate this case we change the definition
of the DEATH RATE in Eq. (3.4) to
DEATH RATE ¼
À
IF DR DIST CONTROL > NOMINAL DR THEN
DR DIST CONTROL ELSE NOMINAL DR
Á
ð3:5Þ
To specify the model in this way, note that you will need a connector from
NOMINAL DR to DEATH RATE. Here we find a lower mean population size of
not quite 14, down from the previous model run of about 20 (Fig. 3.3). Can you
explain why?
The results above were all derived for a fixed nominal death rate. Yet, the
nominal death rate may slowly decline over time as the population grows. This is
certainly the case for the human population that, through advancements in medicine
and political treaties, has significantly reduced the death rate in parts of the world.
How do our results change if we have on the one hand a decline in the nominal
death rate and on the other hand an increase in the standard deviation above the
mean DR DISTRIBUTION? We model the decline in the nominal death rate as
NOMINAL DR ¼ EXP À:01 Ã TIME
ð
Þ Ã :03 þ :01
ð3:6Þ
Fig. 3.3
44
3 Risky Population
The population becomes large enough to be constrained by the sudden switches in
its death brought on by the sheer size of the population, even allowing that many of
these switches are death rate-reducing.
How do the results of our model change if the DEATH RATE is allowed only to
increase above the NOMINAL DR (up to 1.0), from period to period? This is the
second test case described above. To investigate this case we change the definition
of the DEATH RATE in Eq. (3.4) to
DEATH RATE ¼
À
IF DR DIST CONTROL > NOMINAL DR THEN
DR DIST CONTROL ELSE NOMINAL DR
Á
ð3:5Þ
To specify the model in this way, note that you will need a connector from
NOMINAL DR to DEATH RATE. Here we find a lower mean population size of
not quite 14, down from the previous model run of about 20 (Fig. 3.3). Can you
explain why?
The results above were all derived for a fixed nominal death rate. Yet, the
nominal death rate may slowly decline over time as the population grows. This is
certainly the case for the human population that, through advancements in medicine
and political treaties, has significantly reduced the death rate in parts of the world.
How do our results change if we have on the one hand a decline in the nominal
death rate and on the other hand an increase in the standard deviation above the
mean DR DISTRIBUTION? We model the decline in the nominal death rate as
NOMINAL DR ¼ EXP À:01 Ã TIME
ð
Þ Ã :03 þ :01
ð3:6Þ
Fig. 3.3
44
3 Risky Population