

population influx; immigration and emigration from outside the four regions are not
included. Average clutch size is 14 eggs, with 40 % of the total number of females
having at least one nest during the year. On average, 43.7 % of the nests survive
incubation [5].
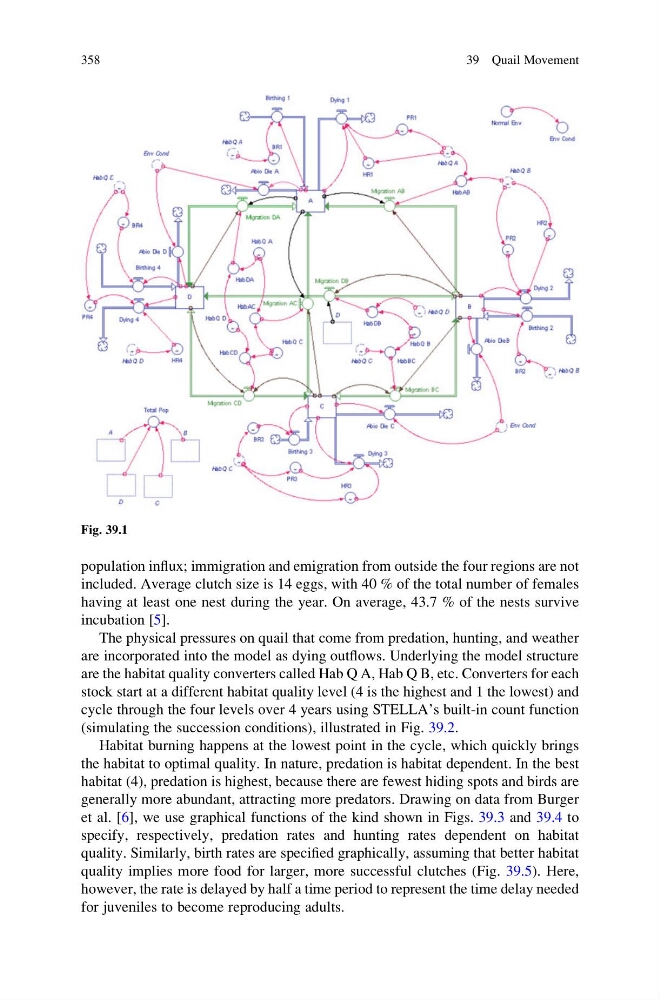
The physical pressures on quail that come from predation, hunting, and weather
are incorporated into the model as dying outflows. Underlying the model structure
are the habitat quality converters called Hab Q A, Hab Q B, etc. Converters for each
stock start at a different habitat quality level (4 is the highest and 1 the lowest) and
cycle through the four levels over 4 years using STELLA’s built-in count function
(simulating the succession conditions), illustrated in Fig. 39.2.
Habitat burning happens at the lowest point in the cycle, which quickly brings
the habitat to optimal quality. In nature, predation is habitat dependent. In the best
habitat (4), predation is highest, because there are fewest hiding spots and birds are
generally more abundant, attracting more predators. Drawing on data from Burger
et al. [6], we use graphical functions of the kind shown in Figs. 39.3 and 39.4 to
specify, respectively, predation rates and hunting rates dependent on habitat
quality. Similarly, birth rates are specified graphically, assuming that better habitat
quality implies more food for larger, more successful clutches (Fig. 39.5). Here,
however, the rate is delayed by half a time period to represent the time delay needed
for juveniles to become reproducing adults.
Fig. 39.1
358
39 Quail Movement
included. Average clutch size is 14 eggs, with 40 % of the total number of females
having at least one nest during the year. On average, 43.7 % of the nests survive
incubation [5].
The physical pressures on quail that come from predation, hunting, and weather
are incorporated into the model as dying outflows. Underlying the model structure
are the habitat quality converters called Hab Q A, Hab Q B, etc. Converters for each
stock start at a different habitat quality level (4 is the highest and 1 the lowest) and
cycle through the four levels over 4 years using STELLA’s built-in count function
(simulating the succession conditions), illustrated in Fig. 39.2.
Habitat burning happens at the lowest point in the cycle, which quickly brings
the habitat to optimal quality. In nature, predation is habitat dependent. In the best
habitat (4), predation is highest, because there are fewest hiding spots and birds are
generally more abundant, attracting more predators. Drawing on data from Burger
et al. [6], we use graphical functions of the kind shown in Figs. 39.3 and 39.4 to
specify, respectively, predation rates and hunting rates dependent on habitat
quality. Similarly, birth rates are specified graphically, assuming that better habitat
quality implies more food for larger, more successful clutches (Fig. 39.5). Here,
however, the rate is delayed by half a time period to represent the time delay needed
for juveniles to become reproducing adults.
Fig. 39.1
358
39 Quail Movement