

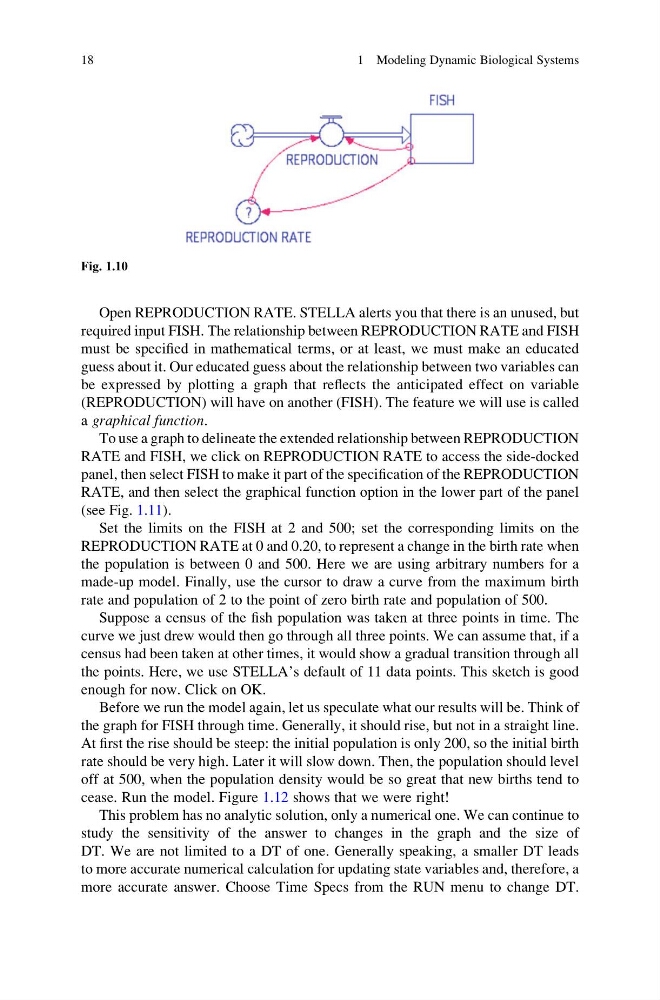
Open REPRODUCTION RATE. STELLA alerts you that there is an unused, but
required input FISH. The relationship between REPRODUCTION RATE and FISH
must be specified in mathematical terms, or at least, we must make an educated
guess about it. Our educated guess about the relationship between two variables can
be expressed by plotting a graph that reflects the anticipated effect on variable
(REPRODUCTION) will have on another (FISH). The feature we will use is called
a graphical function.
To use a graph to delineate the extended relationship between REPRODUCTION
RATE and FISH, we click on REPRODUCTION RATE to access the side-docked
panel, then select FISH to make it part of the specification of the REPRODUCTION
RATE, and then select the graphical function option in the lower part of the panel
(see Fig. 1.11).
Set the limits on the FISH at 2 and 500; set the corresponding limits on the
REPRODUCTION RATE at 0 and 0.20, to represent a change in the birth rate when
the population is between 0 and 500. Here we are using arbitrary numbers for a
made-up model. Finally, use the cursor to draw a curve from the maximum birth
rate and population of 2 to the point of zero birth rate and population of 500.
Suppose a census of the fish population was taken at three points in time. The
curve we just drew would then go through all three points. We can assume that, if a
census had been taken at other times, it would show a gradual transition through all
the points. Here, we use STELLA’s default of 11 data points. This sketch is good
enough for now. Click on OK.
Before we run the model again, let us speculate what our results will be. Think of
the graph for FISH through time. Generally, it should rise, but not in a straight line.
At first the rise should be steep: the initial population is only 200, so the initial birth
rate should be very high. Later it will slow down. Then, the population should level
off at 500, when the population density would be so great that new births tend to
cease. Run the model. Figure 1.12 shows that we were right!
This problem has no analytic solution, only a numerical one. We can continue to
study the sensitivity of the answer to changes in the graph and the size of
DT. We are not limited to a DT of one. Generally speaking, a smaller DT leads
to more accurate numerical calculation for updating state variables and, therefore, a
more accurate answer. Choose Time Specs from the RUN menu to change DT.
Fig. 1.10
18
1 Modeling Dynamic Biological Systems
required input FISH. The relationship between REPRODUCTION RATE and FISH
must be specified in mathematical terms, or at least, we must make an educated
guess about it. Our educated guess about the relationship between two variables can
be expressed by plotting a graph that reflects the anticipated effect on variable
(REPRODUCTION) will have on another (FISH). The feature we will use is called
a graphical function.
To use a graph to delineate the extended relationship between REPRODUCTION
RATE and FISH, we click on REPRODUCTION RATE to access the side-docked
panel, then select FISH to make it part of the specification of the REPRODUCTION
RATE, and then select the graphical function option in the lower part of the panel
(see Fig. 1.11).
Set the limits on the FISH at 2 and 500; set the corresponding limits on the
REPRODUCTION RATE at 0 and 0.20, to represent a change in the birth rate when
the population is between 0 and 500. Here we are using arbitrary numbers for a
made-up model. Finally, use the cursor to draw a curve from the maximum birth
rate and population of 2 to the point of zero birth rate and population of 500.
Suppose a census of the fish population was taken at three points in time. The
curve we just drew would then go through all three points. We can assume that, if a
census had been taken at other times, it would show a gradual transition through all
the points. Here, we use STELLA’s default of 11 data points. This sketch is good
enough for now. Click on OK.
Before we run the model again, let us speculate what our results will be. Think of
the graph for FISH through time. Generally, it should rise, but not in a straight line.
At first the rise should be steep: the initial population is only 200, so the initial birth
rate should be very high. Later it will slow down. Then, the population should level
off at 500, when the population density would be so great that new births tend to
cease. Run the model. Figure 1.12 shows that we were right!
This problem has no analytic solution, only a numerical one. We can continue to
study the sensitivity of the answer to changes in the graph and the size of
DT. We are not limited to a DT of one. Generally speaking, a smaller DT leads
to more accurate numerical calculation for updating state variables and, therefore, a
more accurate answer. Choose Time Specs from the RUN menu to change DT.
Fig. 1.10
18
1 Modeling Dynamic Biological Systems