

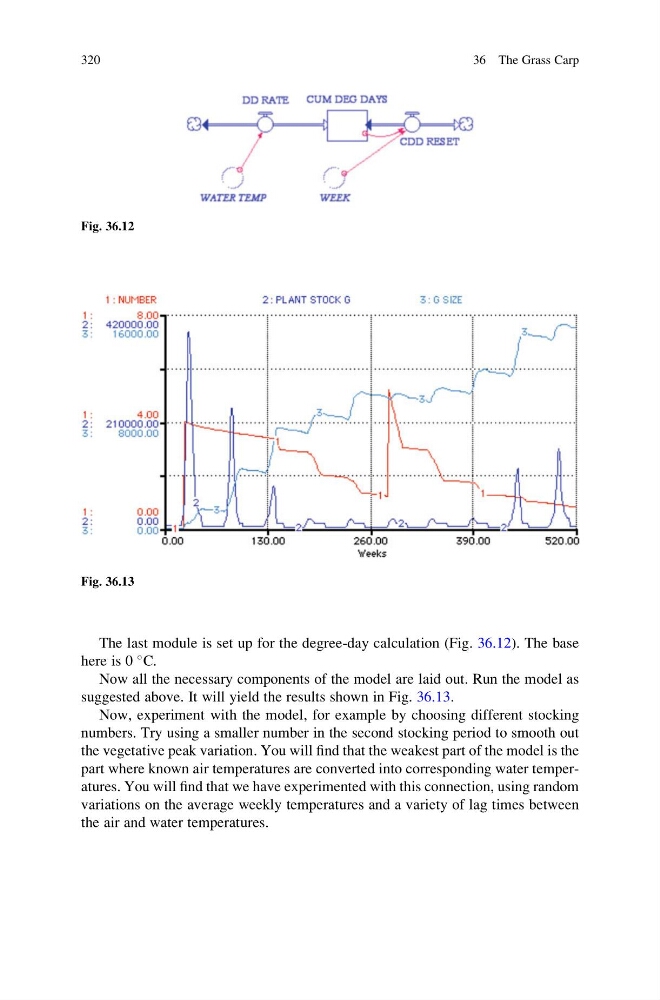
The last module is set up for the degree-day calculation (Fig. 36.12). The base
here is 0
C.
Now all the necessary components of the model are laid out. Run the model as
suggested above. It will yield the results shown in Fig. 36.13.
Now, experiment with the model, for example by choosing different stocking
numbers. Try using a smaller number in the second stocking period to smooth out
the vegetative peak variation. You will find that the weakest part of the model is the
part where known air temperatures are converted into corresponding water temperatures. You will find that we have experimented with this connection, using random
variations on the average weekly temperatures and a variety of lag times between
the air and water temperatures.
Fig. 36.12
Fig. 36.13
320
36 The Grass Carp
here is 0
C.
Now all the necessary components of the model are laid out. Run the model as
suggested above. It will yield the results shown in Fig. 36.13.
Now, experiment with the model, for example by choosing different stocking
numbers. Try using a smaller number in the second stocking period to smooth out
the vegetative peak variation. You will find that the weakest part of the model is the
part where known air temperatures are converted into corresponding water temperatures. You will find that we have experimented with this connection, using random
variations on the average weekly temperatures and a variety of lag times between
the air and water temperatures.
Fig. 36.12
Fig. 36.13
320
36 The Grass Carp