

A minimum level of vegetation (5,000 g) is preserved for regeneration and care must
be taken to insure that plant mortality does not exceed this limit, P MORT TENAT
P MORT TENAT ¼ 7 Ã INSTANT MORT Ã PLANT STOCK G
à TEMP SWITCH M:
ð36:18Þ
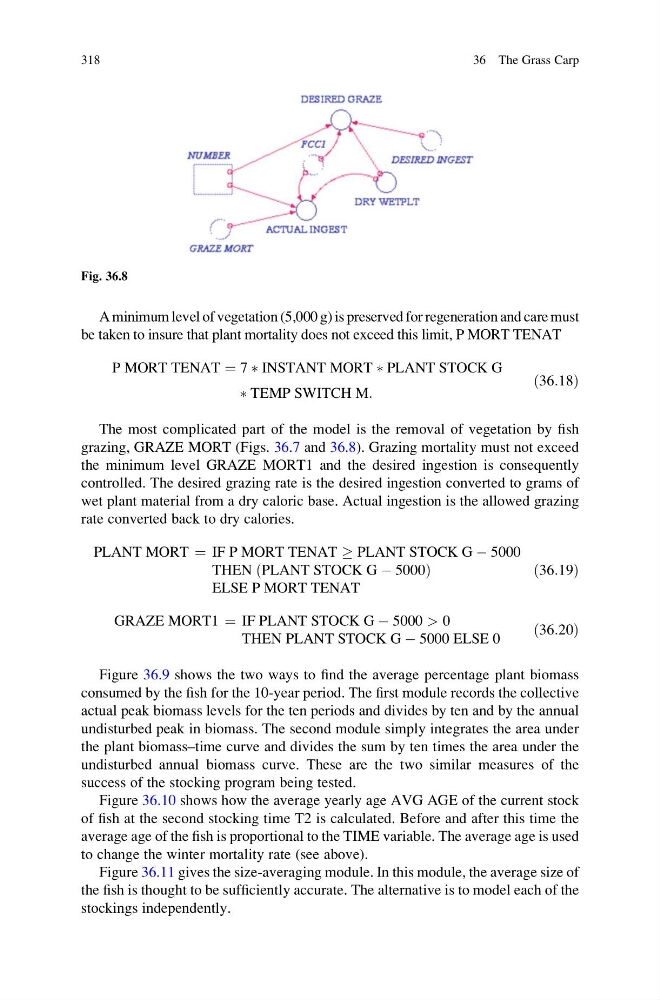
The most complicated part of the model is the removal of vegetation by fish
grazing, GRAZE MORT (Figs. 36.7 and 36.8). Grazing mortality must not exceed
the minimum level GRAZE MORT1 and the desired ingestion is consequently
controlled. The desired grazing rate is the desired ingestion converted to grams of
wet plant material from a dry caloric base. Actual ingestion is the allowed grazing
rate converted back to dry calories.
PLANT MORT ¼ IF P MORT TENAT ! PLANT STOCK G À 5000
THEN PLANT STOCK G À 5000
ð
Þ
ELSE P MORT TENAT
ð36:19Þ
GRAZE MORT1 ¼ IF PLANT STOCK G À 5000 > 0
THEN PLANT STOCK G À 5000 ELSE 0
ð36:20Þ
Figure 36.9 shows the two ways to find the average percentage plant biomass
consumed by the fish for the 10-year period. The first module records the collective
actual peak biomass levels for the ten periods and divides by ten and by the annual
undisturbed peak in biomass. The second module simply integrates the area under
the plant biomass–time curve and divides the sum by ten times the area under the
undisturbed annual biomass curve. These are the two similar measures of the
success of the stocking program being tested.
Figure 36.10 shows how the average yearly age AVG AGE of the current stock
of fish at the second stocking time T2 is calculated. Before and after this time the
average age of the fish is proportional to the TIME variable. The average age is used
to change the winter mortality rate (see above).
Figure 36.11 gives the size-averaging module. In this module, the average size of
the fish is thought to be sufficiently accurate. The alternative is to model each of the
stockings independently.
Fig. 36.8
318
36 The Grass Carp
be taken to insure that plant mortality does not exceed this limit, P MORT TENAT
P MORT TENAT ¼ 7 Ã INSTANT MORT Ã PLANT STOCK G
à TEMP SWITCH M:
ð36:18Þ
The most complicated part of the model is the removal of vegetation by fish
grazing, GRAZE MORT (Figs. 36.7 and 36.8). Grazing mortality must not exceed
the minimum level GRAZE MORT1 and the desired ingestion is consequently
controlled. The desired grazing rate is the desired ingestion converted to grams of
wet plant material from a dry caloric base. Actual ingestion is the allowed grazing
rate converted back to dry calories.
PLANT MORT ¼ IF P MORT TENAT ! PLANT STOCK G À 5000
THEN PLANT STOCK G À 5000
ð
Þ
ELSE P MORT TENAT
ð36:19Þ
GRAZE MORT1 ¼ IF PLANT STOCK G À 5000 > 0
THEN PLANT STOCK G À 5000 ELSE 0
ð36:20Þ
Figure 36.9 shows the two ways to find the average percentage plant biomass
consumed by the fish for the 10-year period. The first module records the collective
actual peak biomass levels for the ten periods and divides by ten and by the annual
undisturbed peak in biomass. The second module simply integrates the area under
the plant biomass–time curve and divides the sum by ten times the area under the
undisturbed annual biomass curve. These are the two similar measures of the
success of the stocking program being tested.
Figure 36.10 shows how the average yearly age AVG AGE of the current stock
of fish at the second stocking time T2 is calculated. Before and after this time the
average age of the fish is proportional to the TIME variable. The average age is used
to change the winter mortality rate (see above).
Figure 36.11 gives the size-averaging module. In this module, the average size of
the fish is thought to be sufficiently accurate. The alternative is to model each of the
stockings independently.
Fig. 36.8
318
36 The Grass Carp