

Figure 33.5 shows the combined result of the population dynamics due to natural
increases and deaths as well as migration. Note how ensuing runs with the same
parameters and initial conditions are significantly different. Why is this difference
occurring? The diseased insects are at a “disadvantage” here. What would you
change within realm of the biologically likely, to favor the diseased population? Is
it possible that by studying insect population dynamics from an ecological perspective we can provide a more useful means for biological control? Can you implement
such a control in the model?
Over the long run, the population of each field is clearly responding to changes in
the local carrying capacity. Both fields take a while to build up numbers from the
low start, 0.1 adults each of healthy and diseased. Surprisingly, in the run we have
graphed neither field’s total population hugs the carrying capacity very well, but in
other runs we made it sometimes did. Clearly there are other factors at work
limiting population besides carrying capacity. While we’ve required that 10 % of
healthy adults migrate, we aren’t seeing the diseased population expand to fill that
gap. Run the model repeatedly and note the differences. Introduce additional factors
such as seasonality into the population model.
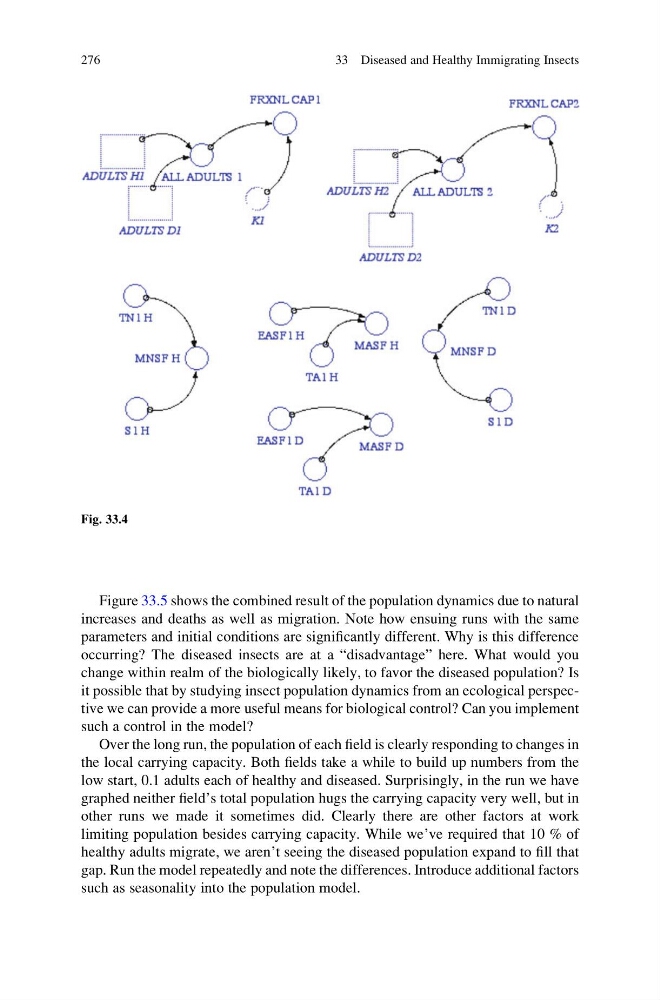
Fig. 33.4
276
33 Diseased and Healthy Immigrating Insects
increases and deaths as well as migration. Note how ensuing runs with the same
parameters and initial conditions are significantly different. Why is this difference
occurring? The diseased insects are at a “disadvantage” here. What would you
change within realm of the biologically likely, to favor the diseased population? Is
it possible that by studying insect population dynamics from an ecological perspective we can provide a more useful means for biological control? Can you implement
such a control in the model?
Over the long run, the population of each field is clearly responding to changes in
the local carrying capacity. Both fields take a while to build up numbers from the
low start, 0.1 adults each of healthy and diseased. Surprisingly, in the run we have
graphed neither field’s total population hugs the carrying capacity very well, but in
other runs we made it sometimes did. Clearly there are other factors at work
limiting population besides carrying capacity. While we’ve required that 10 % of
healthy adults migrate, we aren’t seeing the diseased population expand to fill that
gap. Run the model repeatedly and note the differences. Introduce additional factors
such as seasonality into the population model.
Fig. 33.4
276
33 Diseased and Healthy Immigrating Insects