

DD ¼ IF DAILY MEAN TEMP þ 10 < BASE TEMP THEN 0 ELSE
DAILY MEAN TEMP þ 10 À BASE TEMP
ð
Þ =2
ð26:8Þ
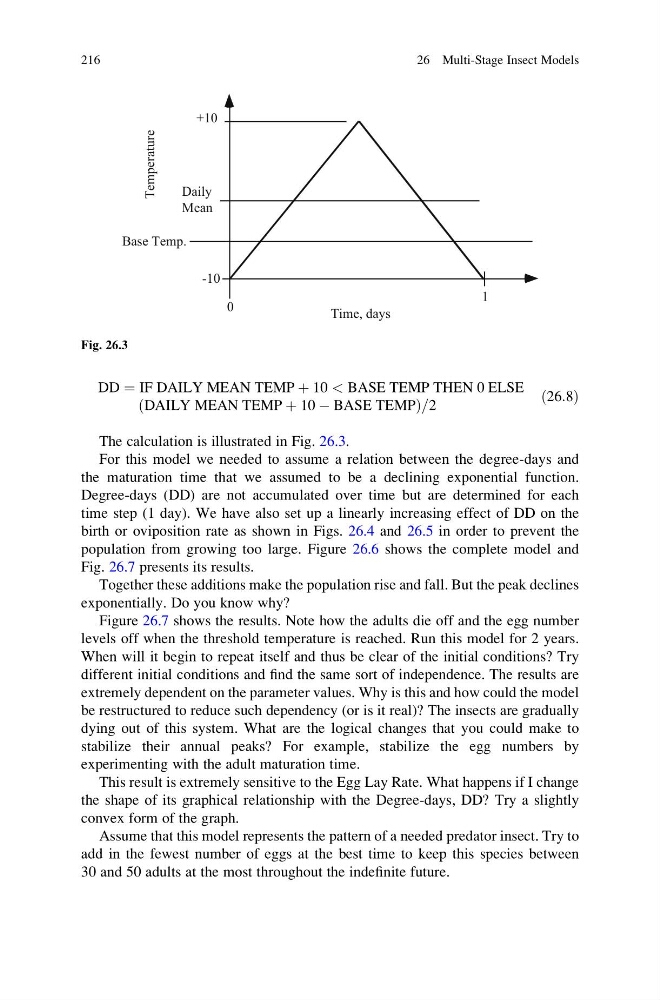
The calculation is illustrated in Fig. 26.3.
For this model we needed to assume a relation between the degree-days and
the maturation time that we assumed to be a declining exponential function.
Degree-days (DD) are not accumulated over time but are determined for each
time step (1 day). We have also set up a linearly increasing effect of DD on the
birth or oviposition rate as shown in Figs. 26.4 and 26.5 in order to prevent the
population from growing too large. Figure 26.6 shows the complete model and
Fig. 26.7 presents its results.
Together these additions make the population rise and fall. But the peak declines
exponentially. Do you know why?
Figure 26.7 shows the results. Note how the adults die off and the egg number
levels off when the threshold temperature is reached. Run this model for 2 years.
When will it begin to repeat itself and thus be clear of the initial conditions? Try
different initial conditions and find the same sort of independence. The results are
extremely dependent on the parameter values. Why is this and how could the model
be restructured to reduce such dependency (or is it real)? The insects are gradually
dying out of this system. What are the logical changes that you could make to
stabilize their annual peaks? For example, stabilize the egg numbers by
experimenting with the adult maturation time.
This result is extremely sensitive to the Egg Lay Rate. What happens if I change
the shape of its graphical relationship with the Degree-days, DD? Try a slightly
convex form of the graph.
Assume that this model represents the pattern of a needed predator insect. Try to
add in the fewest number of eggs at the best time to keep this species between
30 and 50 adults at the most throughout the indefinite future.
1
0
Time, days
Temperature
Base Temp.
Daily
Mean
-10
+10
Fig. 26.3
216
26 Multi-Stage Insect Models
DAILY MEAN TEMP þ 10 À BASE TEMP
ð
Þ =2
ð26:8Þ
The calculation is illustrated in Fig. 26.3.
For this model we needed to assume a relation between the degree-days and
the maturation time that we assumed to be a declining exponential function.
Degree-days (DD) are not accumulated over time but are determined for each
time step (1 day). We have also set up a linearly increasing effect of DD on the
birth or oviposition rate as shown in Figs. 26.4 and 26.5 in order to prevent the
population from growing too large. Figure 26.6 shows the complete model and
Fig. 26.7 presents its results.
Together these additions make the population rise and fall. But the peak declines
exponentially. Do you know why?
Figure 26.7 shows the results. Note how the adults die off and the egg number
levels off when the threshold temperature is reached. Run this model for 2 years.
When will it begin to repeat itself and thus be clear of the initial conditions? Try
different initial conditions and find the same sort of independence. The results are
extremely dependent on the parameter values. Why is this and how could the model
be restructured to reduce such dependency (or is it real)? The insects are gradually
dying out of this system. What are the logical changes that you could make to
stabilize their annual peaks? For example, stabilize the egg numbers by
experimenting with the adult maturation time.
This result is extremely sensitive to the Egg Lay Rate. What happens if I change
the shape of its graphical relationship with the Degree-days, DD? Try a slightly
convex form of the graph.
Assume that this model represents the pattern of a needed predator insect. Try to
add in the fewest number of eggs at the best time to keep this species between
30 and 50 adults at the most throughout the indefinite future.
1
0
Time, days
Temperature
Base Temp.
Daily
Mean
-10
+10
Fig. 26.3
216
26 Multi-Stage Insect Models