

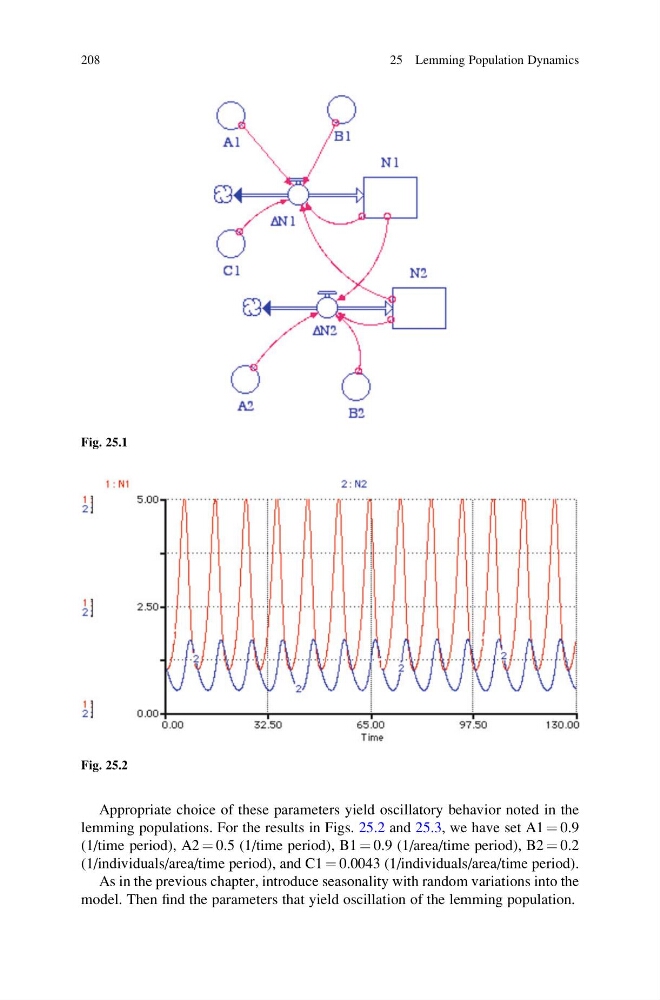
Appropriate choice of these parameters yield oscillatory behavior noted in the
lemming populations. For the results in Figs. 25.2 and 25.3, we have set A1 ¼ 0.9
(1/time period), A2 ¼ 0.5 (1/time period), B1 ¼ 0.9 (1/area/time period), B2 ¼ 0.2
(1/individuals/area/time period), and C1 ¼ 0.0043 (1/individuals/area/time period).
As in the previous chapter, introduce seasonality with random variations into the
model. Then find the parameters that yield oscillation of the lemming population.
Fig. 25.1
Fig. 25.2
208
25 Lemming Population Dynamics
lemming populations. For the results in Figs. 25.2 and 25.3, we have set A1 ¼ 0.9
(1/time period), A2 ¼ 0.5 (1/time period), B1 ¼ 0.9 (1/area/time period), B2 ¼ 0.2
(1/individuals/area/time period), and C1 ¼ 0.0043 (1/individuals/area/time period).
As in the previous chapter, introduce seasonality with random variations into the
model. Then find the parameters that yield oscillation of the lemming population.
Fig. 25.1
Fig. 25.2
208
25 Lemming Population Dynamics