

5. Risk Assessment of a Proposed Introduction of Pacific Salmon
67
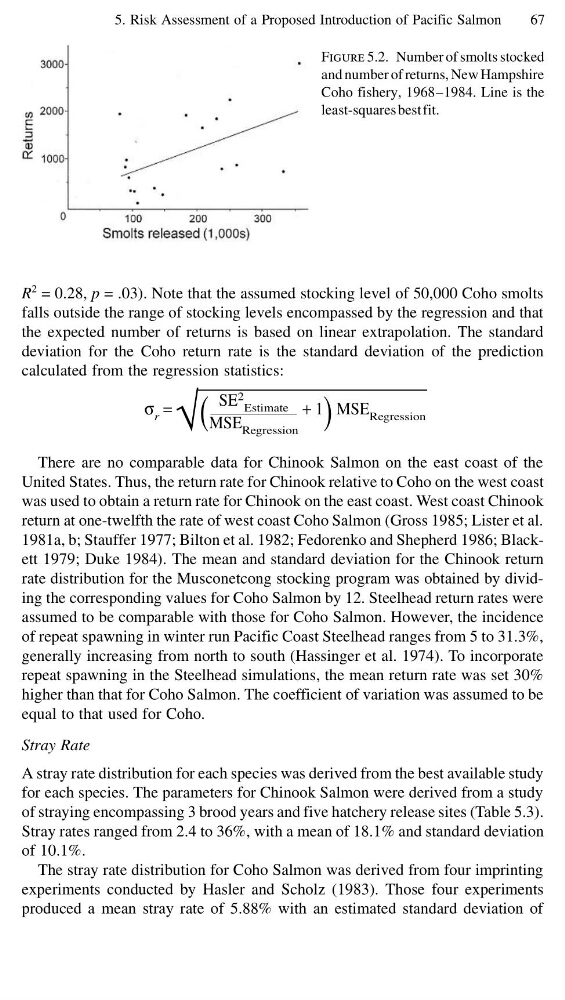
Figure 5.2. Number of smolts stocked
and number of returns, New Hampshire
Coho fishery, 1968–1984. Line is the
least-squares best fit.
R
2 = 0.28, p = .03). Note that the assumed stocking level of 50,000 Coho smolts
falls outside the range of stocking levels encompassed by the regression and that
the expected number of returns is based on linear extrapolation. The standard
deviation for the Coho return rate is the standard deviation of the prediction
calculated from the regression statistics:
σ r =
√ ( MSE Regression
+ 1
)
MSE Regression
SE
2
Estimate
There are no comparable data for Chinook Salmon on the east coast of the
United States. Thus, the return rate for Chinook relative to Coho on the west coast
was used to obtain a return rate for Chinook on the east coast. West coast Chinook
return at one-twelfth the rate of west coast Coho Salmon (Gross 1985; Lister et al.
1981a, b; Stauffer 1977; Bilton et al. 1982; Fedorenko and Shepherd 1986; Blackett 1979; Duke 1984). The mean and standard deviation for the Chinook return
rate distribution for the Musconetcong stocking program was obtained by dividing the corresponding values for Coho Salmon by 12. Steelhead return rates were
assumed to be comparable with those for Coho Salmon. However, the incidence
of repeat spawning in winter run Pacific Coast Steelhead ranges from 5 to 31.3%,
generally increasing from north to south (Hassinger et al. 1974). To incorporate
repeat spawning in the Steelhead simulations, the mean return rate was set 30%
higher than that for Coho Salmon. The coefficient of variation was assumed to be
equal to that used for Coho.
Stray Rate
A stray rate distribution for each species was derived from the best available study
for each species. The parameters for Chinook Salmon were derived from a study
of straying encompassing 3 brood years and five hatchery release sites (Table 5.3).
Stray rates ranged from 2.4 to 36%, with a mean of 18.1% and standard deviation
of 10.1%.
The stray rate distribution for Coho Salmon was derived from four imprinting
experiments conducted by Hasler and Scholz (1983). Those four experiments
produced a mean stray rate of 5.88% with an estimated standard deviation of
67
Figure 5.2. Number of smolts stocked
and number of returns, New Hampshire
Coho fishery, 1968–1984. Line is the
least-squares best fit.
R
2 = 0.28, p = .03). Note that the assumed stocking level of 50,000 Coho smolts
falls outside the range of stocking levels encompassed by the regression and that
the expected number of returns is based on linear extrapolation. The standard
deviation for the Coho return rate is the standard deviation of the prediction
calculated from the regression statistics:
σ r =
√ ( MSE Regression
+ 1
)
MSE Regression
SE
2
Estimate
There are no comparable data for Chinook Salmon on the east coast of the
United States. Thus, the return rate for Chinook relative to Coho on the west coast
was used to obtain a return rate for Chinook on the east coast. West coast Chinook
return at one-twelfth the rate of west coast Coho Salmon (Gross 1985; Lister et al.
1981a, b; Stauffer 1977; Bilton et al. 1982; Fedorenko and Shepherd 1986; Blackett 1979; Duke 1984). The mean and standard deviation for the Chinook return
rate distribution for the Musconetcong stocking program was obtained by dividing the corresponding values for Coho Salmon by 12. Steelhead return rates were
assumed to be comparable with those for Coho Salmon. However, the incidence
of repeat spawning in winter run Pacific Coast Steelhead ranges from 5 to 31.3%,
generally increasing from north to south (Hassinger et al. 1974). To incorporate
repeat spawning in the Steelhead simulations, the mean return rate was set 30%
higher than that for Coho Salmon. The coefficient of variation was assumed to be
equal to that used for Coho.
Stray Rate
A stray rate distribution for each species was derived from the best available study
for each species. The parameters for Chinook Salmon were derived from a study
of straying encompassing 3 brood years and five hatchery release sites (Table 5.3).
Stray rates ranged from 2.4 to 36%, with a mean of 18.1% and standard deviation
of 10.1%.
The stray rate distribution for Coho Salmon was derived from four imprinting
experiments conducted by Hasler and Scholz (1983). Those four experiments
produced a mean stray rate of 5.88% with an estimated standard deviation of