

18
Mark Burgman et al.
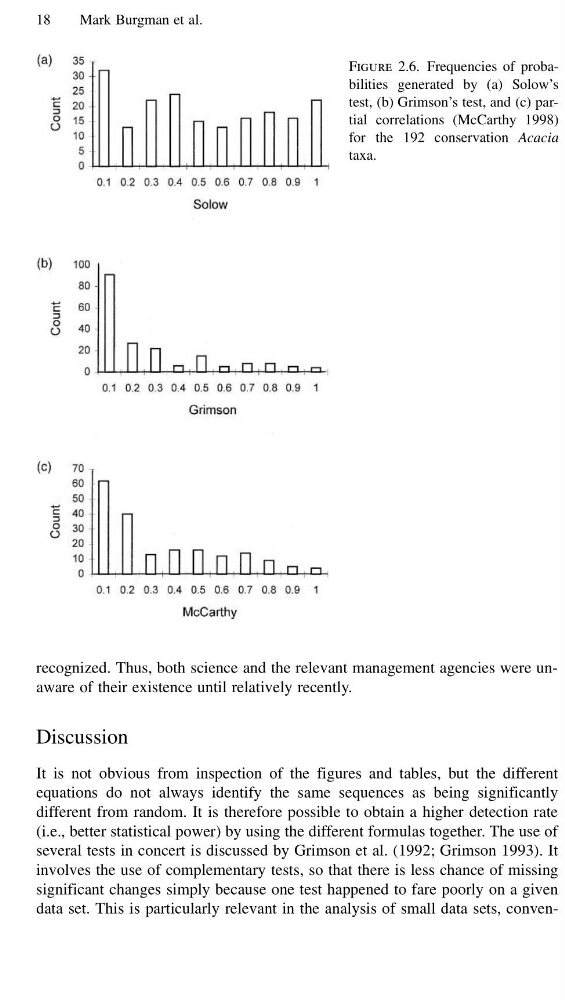
Figure 2.6. Frequencies of probabilities generated by (a) Solow’s
test, (b) Grimson’s test, and (c) partial correlations (McCarthy 1998)
for the 192 conservation Acacia
taxa.
recognized. Thus, both science and the relevant management agencies were unaware of their existence until relatively recently.
Discussion
It is not obvious from inspection of the figures and tables, but the different
equations do not always identify the same sequences as being significantly
different from random. It is therefore possible to obtain a higher detection rate
(i.e., better statistical power) by using the different formulas together. The use of
several tests in concert is discussed by Grimson et al. (1992; Grimson 1993). It
involves the use of complementary tests, so that there is less chance of missing
significant changes simply because one test happened to fare poorly on a given
data set. This is particularly relevant in the analysis of small data sets, conven-
Mark Burgman et al.
Figure 2.6. Frequencies of probabilities generated by (a) Solow’s
test, (b) Grimson’s test, and (c) partial correlations (McCarthy 1998)
for the 192 conservation Acacia
taxa.
recognized. Thus, both science and the relevant management agencies were unaware of their existence until relatively recently.
Discussion
It is not obvious from inspection of the figures and tables, but the different
equations do not always identify the same sequences as being significantly
different from random. It is therefore possible to obtain a higher detection rate
(i.e., better statistical power) by using the different formulas together. The use of
several tests in concert is discussed by Grimson et al. (1992; Grimson 1993). It
involves the use of complementary tests, so that there is less chance of missing
significant changes simply because one test happened to fare poorly on a given
data set. This is particularly relevant in the analysis of small data sets, conven-