

17. Mathematical Methods for Identifying Representative Reserve Networks
295
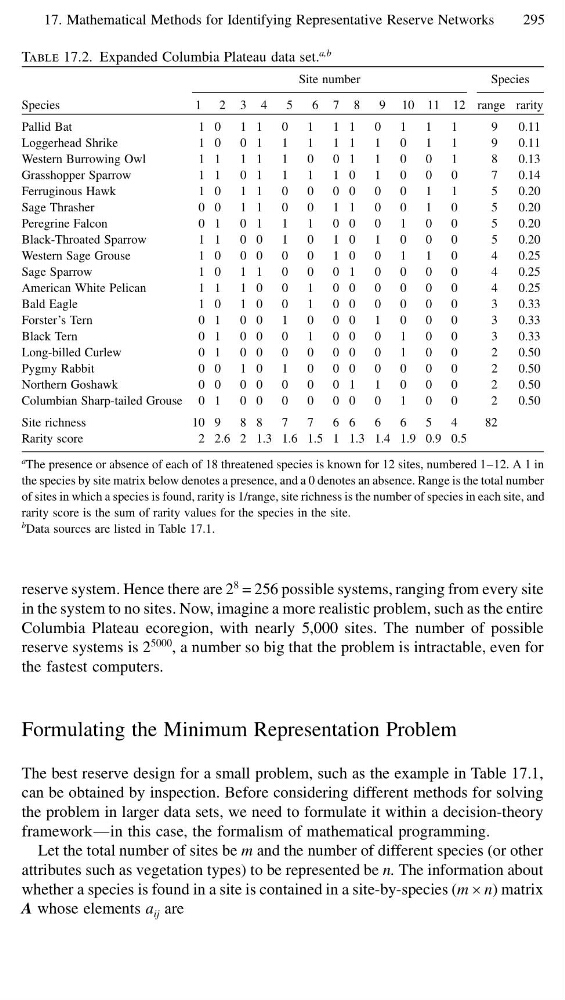
Table 17.2. Expanded Columbia Plateau data set.
a,b
Species
Site number
1 2 3 4
5
6 7 8
9 10 11 12
Species
range rarity
Pallid Bat
1 0
1 1
0
1
1 1
0
1
1
1
9
0.11
Loggerhead Shrike
1 0
0 1
1
1
1 1
1
0
1
1
9
0.11
Western Burrowing Owl
1 1
1 1
1
0
0 1
1
0
0
1
8
0.13
Grasshopper Sparrow
1 1
0 1
1
1
1 0
1
0
0
0
7
0.14
Ferruginous Hawk
1 0
1 1
0
0
0 0
0
0
1
1
5
0.20
Sage Thrasher
0 0
1 1
0
0
1 1
0
0
1
0
5
0.20
Peregrine Falcon
0 1
0 1
1
1
0 0
0
1
0
0
5
0.20
Black-Throated Sparrow
1 1
0 0
1
0
1 0
1
0
0
0
5
0.20
Western Sage Grouse
1 0
0 0
0
0
1 0
0
1
1
0
4
0.25
Sage Sparrow
1 0
1 1
0
0
0 1
0
0
0
0
4
0.25
American White Pelican
1 1
1 0
0
1
0 0
0
0
0
0
4
0.25
Bald Eagle
1 0
1 0
0
1
0 0
0
0
0
0
3
0.33
Forster’s Tern
0 1
0 0
1
0
0 0
1
0
0
0
3
0.33
Black Tern
0 1
0 0
0
1
0 0
0
1
0
0
3
0.33
Long-billed Curlew
0 1
0 0
0
0
0 0
0
1
0
0
2
0.50
Pygmy Rabbit
0 0
1 0
1
0
0 0
0
0
0
0
2
0.50
Northern Goshawk
0 0
0 0
0
0
0 1
1
0
0
0
2
0.50
Columbian Sharp-tailed Grouse 0 1
0 0
0
0
0 0
0
1
0
0
2
0.50
Site richness
10 9
8 8
7
7
6 6
6
6
5
4
82
Rarity score
2 2.6 2 1.3 1.6 1.5 1 1.3 1.4 1.9 0.9 0.5
a The presence or absence of each of 18 threatened species is known for 12 sites, numbered 1–12. A 1 in
the species by site matrix below denotes a presence, and a 0 denotes an absence. Range is the total number
of sites in which a species is found, rarity is 1/range, site richness is the number of species in each site, and
rarity score is the sum of rarity values for the species in the site.
b Data sources are listed in Table 17.1.
reserve system. Hence there are 2
8 = 256 possible systems, ranging from every site
in the system to no sites. Now, imagine a more realistic problem, such as the entire
Columbia Plateau ecoregion, with nearly 5,000 sites. The number of possible
reserve systems is 2
5000 , a number so big that the problem is intractable, even for
the fastest computers.
Formulating the Minimum Representation Problem
The best reserve design for a small problem, such as the example in Table 17.1,
can be obtained by inspection. Before considering different methods for solving
the problem in larger data sets, we need to formulate it within a decision-theory
framework—in this case, the formalism of mathematical programming.
Let the total number of sites be m and the number of different species (or other
attributes such as vegetation types) to be represented be n. The information about
whether a species is found in a site is contained in a site-by-species (m × n) matrix
A whose elements a ij are
295
Table 17.2. Expanded Columbia Plateau data set.
a,b
Species
Site number
1 2 3 4
5
6 7 8
9 10 11 12
Species
range rarity
Pallid Bat
1 0
1 1
0
1
1 1
0
1
1
1
9
0.11
Loggerhead Shrike
1 0
0 1
1
1
1 1
1
0
1
1
9
0.11
Western Burrowing Owl
1 1
1 1
1
0
0 1
1
0
0
1
8
0.13
Grasshopper Sparrow
1 1
0 1
1
1
1 0
1
0
0
0
7
0.14
Ferruginous Hawk
1 0
1 1
0
0
0 0
0
0
1
1
5
0.20
Sage Thrasher
0 0
1 1
0
0
1 1
0
0
1
0
5
0.20
Peregrine Falcon
0 1
0 1
1
1
0 0
0
1
0
0
5
0.20
Black-Throated Sparrow
1 1
0 0
1
0
1 0
1
0
0
0
5
0.20
Western Sage Grouse
1 0
0 0
0
0
1 0
0
1
1
0
4
0.25
Sage Sparrow
1 0
1 1
0
0
0 1
0
0
0
0
4
0.25
American White Pelican
1 1
1 0
0
1
0 0
0
0
0
0
4
0.25
Bald Eagle
1 0
1 0
0
1
0 0
0
0
0
0
3
0.33
Forster’s Tern
0 1
0 0
1
0
0 0
1
0
0
0
3
0.33
Black Tern
0 1
0 0
0
1
0 0
0
1
0
0
3
0.33
Long-billed Curlew
0 1
0 0
0
0
0 0
0
1
0
0
2
0.50
Pygmy Rabbit
0 0
1 0
1
0
0 0
0
0
0
0
2
0.50
Northern Goshawk
0 0
0 0
0
0
0 1
1
0
0
0
2
0.50
Columbian Sharp-tailed Grouse 0 1
0 0
0
0
0 0
0
1
0
0
2
0.50
Site richness
10 9
8 8
7
7
6 6
6
6
5
4
82
Rarity score
2 2.6 2 1.3 1.6 1.5 1 1.3 1.4 1.9 0.9 0.5
a The presence or absence of each of 18 threatened species is known for 12 sites, numbered 1–12. A 1 in
the species by site matrix below denotes a presence, and a 0 denotes an absence. Range is the total number
of sites in which a species is found, rarity is 1/range, site richness is the number of species in each site, and
rarity score is the sum of rarity values for the species in the site.
b Data sources are listed in Table 17.1.
reserve system. Hence there are 2
8 = 256 possible systems, ranging from every site
in the system to no sites. Now, imagine a more realistic problem, such as the entire
Columbia Plateau ecoregion, with nearly 5,000 sites. The number of possible
reserve systems is 2
5000 , a number so big that the problem is intractable, even for
the fastest computers.
Formulating the Minimum Representation Problem
The best reserve design for a small problem, such as the example in Table 17.1,
can be obtained by inspection. Before considering different methods for solving
the problem in larger data sets, we need to formulate it within a decision-theory
framework—in this case, the formalism of mathematical programming.
Let the total number of sites be m and the number of different species (or other
attributes such as vegetation types) to be represented be n. The information about
whether a species is found in a site is contained in a site-by-species (m × n) matrix
A whose elements a ij are