

2. Inferring Threat from Scientific Collections
11
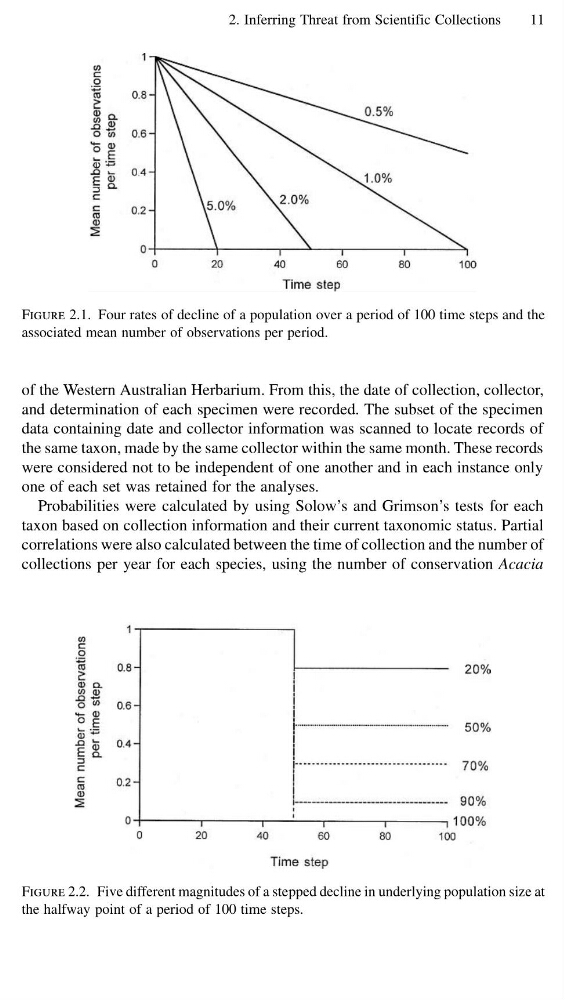
Figure 2.1. Four rates of decline of a population over a period of 100 time steps and the
associated mean number of observations per period.
of the Western Australian Herbarium. From this, the date of collection, collector,
and determination of each specimen were recorded. The subset of the specimen
data containing date and collector information was scanned to locate records of
the same taxon, made by the same collector within the same month. These records
were considered not to be independent of one another and in each instance only
one of each set was retained for the analyses.
Probabilities were calculated by using Solow’s and Grimson’s tests for each
taxon based on collection information and their current taxonomic status. Partial
correlations were also calculated between the time of collection and the number of
collections per year for each species, using the number of conservation Acacia
Figure 2.2. Five different magnitudes of a stepped decline in underlying population size at
the halfway point of a period of 100 time steps.
11
Figure 2.1. Four rates of decline of a population over a period of 100 time steps and the
associated mean number of observations per period.
of the Western Australian Herbarium. From this, the date of collection, collector,
and determination of each specimen were recorded. The subset of the specimen
data containing date and collector information was scanned to locate records of
the same taxon, made by the same collector within the same month. These records
were considered not to be independent of one another and in each instance only
one of each set was retained for the analyses.
Probabilities were calculated by using Solow’s and Grimson’s tests for each
taxon based on collection information and their current taxonomic status. Partial
correlations were also calculated between the time of collection and the number of
collections per year for each species, using the number of conservation Acacia
Figure 2.2. Five different magnitudes of a stepped decline in underlying population size at
the halfway point of a period of 100 time steps.