

184
Lloyd Goldwasser, Scott Ferson, and Lev Ginzburg
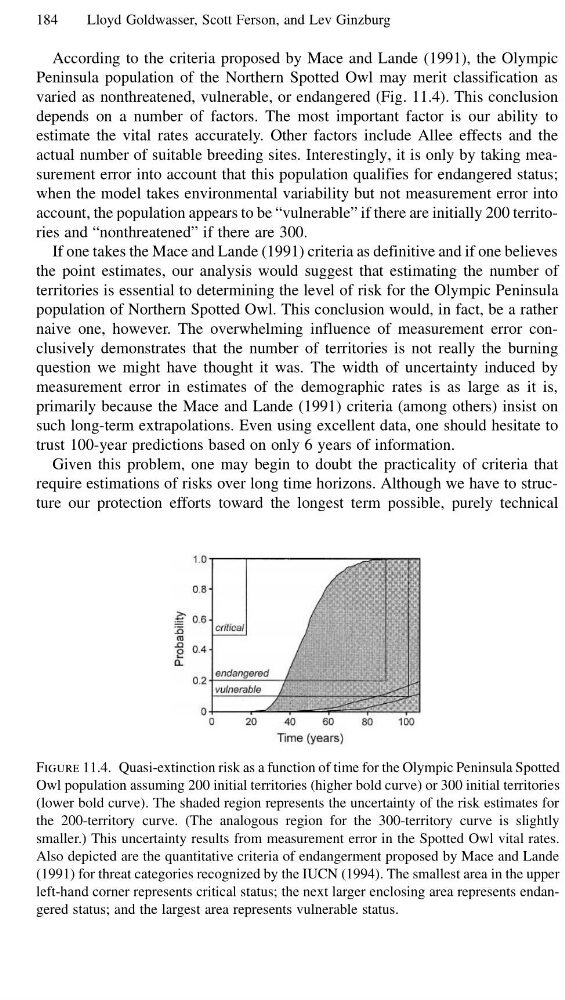
According to the criteria proposed by Mace and Lande (1991), the Olympic
Peninsula population of the Northern Spotted Owl may merit classification as
varied as nonthreatened, vulnerable, or endangered (Fig. 11.4). This conclusion
depends on a number of factors. The most important factor is our ability to
estimate the vital rates accurately. Other factors include Allee effects and the
actual number of suitable breeding sites. Interestingly, it is only by taking measurement error into account that this population qualifies for endangered status;
when the model takes environmental variability but not measurement error into
account, the population appears to be “vulnerable” if there are initially 200 territories and “nonthreatened” if there are 300.
If one takes the Mace and Lande (1991) criteria as definitive and if one believes
the point estimates, our analysis would suggest that estimating the number of
territories is essential to determining the level of risk for the Olympic Peninsula
population of Northern Spotted Owl. This conclusion would, in fact, be a rather
naive one, however. The overwhelming influence of measurement error conclusively demonstrates that the number of territories is not really the burning
question we might have thought it was. The width of uncertainty induced by
measurement error in estimates of the demographic rates is as large as it is,
primarily because the Mace and Lande (1991) criteria (among others) insist on
such long-term extrapolations. Even using excellent data, one should hesitate to
trust 100-year predictions based on only 6 years of information.
Given this problem, one may begin to doubt the practicality of criteria that
require estimations of risks over long time horizons. Although we have to structure our protection efforts toward the longest term possible, purely technical
Figure 11.4. Quasi-extinction risk as a function of time for the Olympic Peninsula Spotted
Owl population assuming 200 initial territories (higher bold curve) or 300 initial territories
(lower bold curve). The shaded region represents the uncertainty of the risk estimates for
the 200-territory curve. (The analogous region for the 300-territory curve is slightly
smaller.) This uncertainty results from measurement error in the Spotted Owl vital rates.
Also depicted are the quantitative criteria of endangerment proposed by Mace and Lande
(1991) for threat categories recognized by the IUCN (1994). The smallest area in the upper
left-hand corner represents critical status; the next larger enclosing area represents endangered status; and the largest area represents vulnerable status.
Lloyd Goldwasser, Scott Ferson, and Lev Ginzburg
According to the criteria proposed by Mace and Lande (1991), the Olympic
Peninsula population of the Northern Spotted Owl may merit classification as
varied as nonthreatened, vulnerable, or endangered (Fig. 11.4). This conclusion
depends on a number of factors. The most important factor is our ability to
estimate the vital rates accurately. Other factors include Allee effects and the
actual number of suitable breeding sites. Interestingly, it is only by taking measurement error into account that this population qualifies for endangered status;
when the model takes environmental variability but not measurement error into
account, the population appears to be “vulnerable” if there are initially 200 territories and “nonthreatened” if there are 300.
If one takes the Mace and Lande (1991) criteria as definitive and if one believes
the point estimates, our analysis would suggest that estimating the number of
territories is essential to determining the level of risk for the Olympic Peninsula
population of Northern Spotted Owl. This conclusion would, in fact, be a rather
naive one, however. The overwhelming influence of measurement error conclusively demonstrates that the number of territories is not really the burning
question we might have thought it was. The width of uncertainty induced by
measurement error in estimates of the demographic rates is as large as it is,
primarily because the Mace and Lande (1991) criteria (among others) insist on
such long-term extrapolations. Even using excellent data, one should hesitate to
trust 100-year predictions based on only 6 years of information.
Given this problem, one may begin to doubt the practicality of criteria that
require estimations of risks over long time horizons. Although we have to structure our protection efforts toward the longest term possible, purely technical
Figure 11.4. Quasi-extinction risk as a function of time for the Olympic Peninsula Spotted
Owl population assuming 200 initial territories (higher bold curve) or 300 initial territories
(lower bold curve). The shaded region represents the uncertainty of the risk estimates for
the 200-territory curve. (The analogous region for the 300-territory curve is slightly
smaller.) This uncertainty results from measurement error in the Spotted Owl vital rates.
Also depicted are the quantitative criteria of endangerment proposed by Mace and Lande
(1991) for threat categories recognized by the IUCN (1994). The smallest area in the upper
left-hand corner represents critical status; the next larger enclosing area represents endangered status; and the largest area represents vulnerable status.