

11. Variability and Measurement Error in Extinction Risk Analysis
181
The distinction between measurement error and natural variability includes the
difference between uncertainty about the value of the parameter at any given
moment and changes in the parameter over time. If a parameter varies stochastically, then uncertainty about future fluctuations is inevitable and may often be
substantial. For instance, a population that, on average, maintains itself adequately can be driven extinct by a series of bad years, and one job of risk
assessment is to estimate the likelihood and probable impact of such a series.
However, inaccuracy in the current estimates of vital rates can give projections
that inevitably diverge from the actual course of the population, whatever the
extent of environmental variability. Measurement error of the temporal variability
of the vital rates also exists and may be fairly large. Considering it, however,
would require a second-order approximation, which we did not attempt here.
Tossing a coin provides a good illustration of the effect of measurement error
on risk analysis. If the probability of tossing heads is known to be p and the
probability of tossing tails (1 − p), well-known statistical results concerning the
binomial distribution give both the expected number of heads after n tosses and
the probability that the number of heads will exceed the number of tails by some
quantity. We are able to perform a perfect risk analysis for any criterion of risk that
we set for ourselves. The particular sequence of outcomes in n tosses is analogous
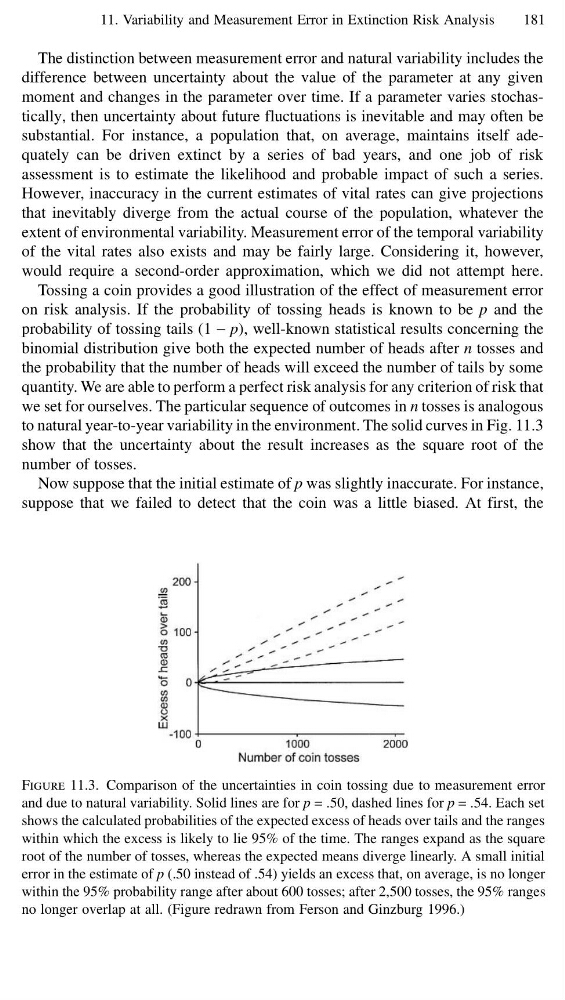
to natural year-to-year variability in the environment. The solid curves in Fig. 11.3
show that the uncertainty about the result increases as the square root of the
number of tosses.
Now suppose that the initial estimate of p was slightly inaccurate. For instance,
suppose that we failed to detect that the coin was a little biased. At first, the
Figure 11.3. Comparison of the uncertainties in coin tossing due to measurement error
and due to natural variability. Solid lines are for p = .50, dashed lines for p = .54. Each set
shows the calculated probabilities of the expected excess of heads over tails and the ranges
within which the excess is likely to lie 95% of the time. The ranges expand as the square
root of the number of tosses, whereas the expected means diverge linearly. A small initial
error in the estimate of p (.50 instead of .54) yields an excess that, on average, is no longer
within the 95% probability range after about 600 tosses; after 2,500 tosses, the 95% ranges
no longer overlap at all. (Figure redrawn from Ferson and Ginzburg 1996.)
181
The distinction between measurement error and natural variability includes the
difference between uncertainty about the value of the parameter at any given
moment and changes in the parameter over time. If a parameter varies stochastically, then uncertainty about future fluctuations is inevitable and may often be
substantial. For instance, a population that, on average, maintains itself adequately can be driven extinct by a series of bad years, and one job of risk
assessment is to estimate the likelihood and probable impact of such a series.
However, inaccuracy in the current estimates of vital rates can give projections
that inevitably diverge from the actual course of the population, whatever the
extent of environmental variability. Measurement error of the temporal variability
of the vital rates also exists and may be fairly large. Considering it, however,
would require a second-order approximation, which we did not attempt here.
Tossing a coin provides a good illustration of the effect of measurement error
on risk analysis. If the probability of tossing heads is known to be p and the
probability of tossing tails (1 − p), well-known statistical results concerning the
binomial distribution give both the expected number of heads after n tosses and
the probability that the number of heads will exceed the number of tails by some
quantity. We are able to perform a perfect risk analysis for any criterion of risk that
we set for ourselves. The particular sequence of outcomes in n tosses is analogous
to natural year-to-year variability in the environment. The solid curves in Fig. 11.3
show that the uncertainty about the result increases as the square root of the
number of tosses.
Now suppose that the initial estimate of p was slightly inaccurate. For instance,
suppose that we failed to detect that the coin was a little biased. At first, the
Figure 11.3. Comparison of the uncertainties in coin tossing due to measurement error
and due to natural variability. Solid lines are for p = .50, dashed lines for p = .54. Each set
shows the calculated probabilities of the expected excess of heads over tails and the ranges
within which the excess is likely to lie 95% of the time. The ranges expand as the square
root of the number of tosses, whereas the expected means diverge linearly. A small initial
error in the estimate of p (.50 instead of .54) yields an excess that, on average, is no longer
within the 95% probability range after about 600 tosses; after 2,500 tosses, the 95% ranges
no longer overlap at all. (Figure redrawn from Ferson and Ginzburg 1996.)