

172
Lloyd Goldwasser, Scott Ferson, and Lev Ginzburg
Table 11.1. Demographic parameters used in this study.
Parameter
Juveniles
Subadults
Adults
Fecundity
Mean value
0.0
0.206
0.380
Temporal variability (SD)
0.0
0.143
0.237
Measurement error (SE)
0.0
0.106
0.036
Survival rate
Mean value
0.358
0.862
0.862
Temporal variability (SD)
0.033
0.033
0.033
Measurement error (SE)
0.064
0.017
0.017
computed an adjustment factor E = 0.3158 to compensate for this bias. This factor
represents the proportion of juveniles that emigrate and survive but are not
detected in subsequent sampling. Although comparable data are available for the
Olympic Peninsula population alone, the sample size is probably too low for the
resulting estimate to be reliable (E. Forsman, personal communication). Accordingly, we have used the correction E = 1.4616 to adjust our rate of juvenile
survival from 0.245 reported by Forsman and colleagues (1993) to 0.358, which
appears in the table. (More recently, Forsman et al. [1996] have estimated this rate
to be 0.611.)
To perform a quantitative population viability analysis, it is necessary to have
estimates for temporal variabilities of the vital rates caused by environmental
stochasticity. We computed standard deviations from seven annual estimates of
fecundity for the Olympic Peninsula population reported by Forsman and coworkers (1993). In this estimation, we used the respective sample sizes as weights
for the data. Unfortunately, comparable information is not available to compute
analogous standard deviations for survival rates. Previous investigators have
found that the temporal variability of survival was not consistent but varied with
other factors such as spatial location (Forsman et al. 1993; Burnham et al. 1994).
This finding suggests that there exists no simple summary that completely characterizes the temporal variation in survival rate for the Northern Spotted Owl as a
whole.
Eric Forsman (personal communication) kindly shared with us the estimates of
year-by-year survival rates for the Olympic Peninsula population. Although there
are statistical grounds to question a simple calculation of the standard deviation of
the year-by-year estimates, for this modeling exercise, and in the absence of better
estimates, we used these values to calculate the standard deviation in adult and
subadult survival due to environmental variability. Because the sample sizes for
juveniles are too low to provide a reliable estimate of their variability in survival
(E. Forsman, personal communication), we used the same value, 0.033, as a
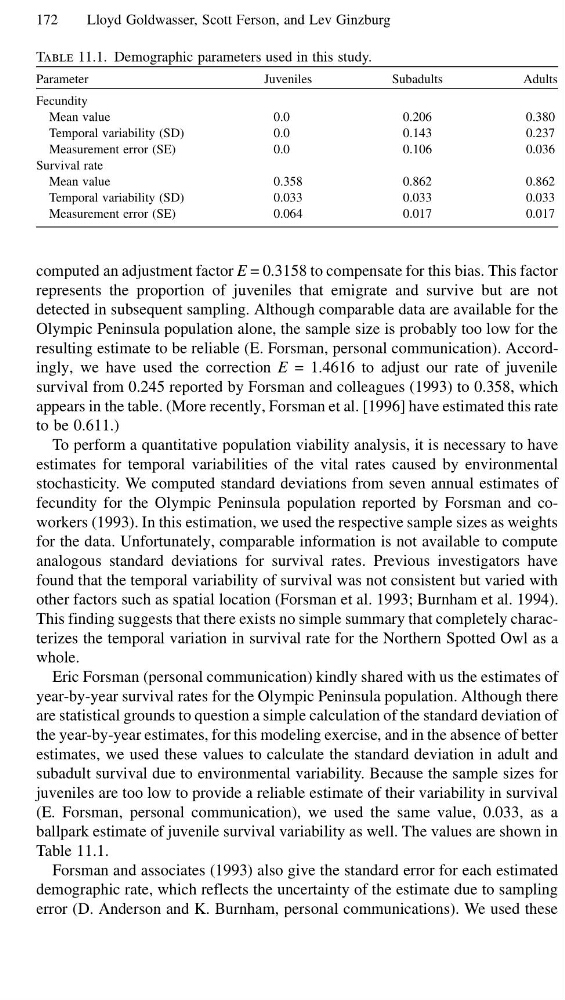
ballpark estimate of juvenile survival variability as well. The values are shown in
Table 11.1.
Forsman and associates (1993) also give the standard error for each estimated
demographic rate, which reflects the uncertainty of the estimate due to sampling
error (D. Anderson and K. Burnham, personal communications). We used these
Lloyd Goldwasser, Scott Ferson, and Lev Ginzburg
Table 11.1. Demographic parameters used in this study.
Parameter
Juveniles
Subadults
Adults
Fecundity
Mean value
0.0
0.206
0.380
Temporal variability (SD)
0.0
0.143
0.237
Measurement error (SE)
0.0
0.106
0.036
Survival rate
Mean value
0.358
0.862
0.862
Temporal variability (SD)
0.033
0.033
0.033
Measurement error (SE)
0.064
0.017
0.017
computed an adjustment factor E = 0.3158 to compensate for this bias. This factor
represents the proportion of juveniles that emigrate and survive but are not
detected in subsequent sampling. Although comparable data are available for the
Olympic Peninsula population alone, the sample size is probably too low for the
resulting estimate to be reliable (E. Forsman, personal communication). Accordingly, we have used the correction E = 1.4616 to adjust our rate of juvenile
survival from 0.245 reported by Forsman and colleagues (1993) to 0.358, which
appears in the table. (More recently, Forsman et al. [1996] have estimated this rate
to be 0.611.)
To perform a quantitative population viability analysis, it is necessary to have
estimates for temporal variabilities of the vital rates caused by environmental
stochasticity. We computed standard deviations from seven annual estimates of
fecundity for the Olympic Peninsula population reported by Forsman and coworkers (1993). In this estimation, we used the respective sample sizes as weights
for the data. Unfortunately, comparable information is not available to compute
analogous standard deviations for survival rates. Previous investigators have
found that the temporal variability of survival was not consistent but varied with
other factors such as spatial location (Forsman et al. 1993; Burnham et al. 1994).
This finding suggests that there exists no simple summary that completely characterizes the temporal variation in survival rate for the Northern Spotted Owl as a
whole.
Eric Forsman (personal communication) kindly shared with us the estimates of
year-by-year survival rates for the Olympic Peninsula population. Although there
are statistical grounds to question a simple calculation of the standard deviation of
the year-by-year estimates, for this modeling exercise, and in the absence of better
estimates, we used these values to calculate the standard deviation in adult and
subadult survival due to environmental variability. Because the sample sizes for
juveniles are too low to provide a reliable estimate of their variability in survival
(E. Forsman, personal communication), we used the same value, 0.033, as a
ballpark estimate of juvenile survival variability as well. The values are shown in
Table 11.1.
Forsman and associates (1993) also give the standard error for each estimated
demographic rate, which reflects the uncertainty of the estimate due to sampling
error (D. Anderson and K. Burnham, personal communications). We used these