

170
Lloyd Goldwasser, Scott Ferson, and Lev Ginzburg
Figure 11.1. Categories recognized by the
federal Endangered Species Act.
graphic stochasticity. The means of dealing quantitatively with these kinds of
uncertainty are reasonably well established (Ginzburg et al. 1982; Lande and
Orzack 1988; Ferson et al. 1989; Burgman et al. 1993). However, measurement
error creates another crucial source of uncertainty that has not been investigated in
most risk analyses, including our own. Errors in the estimates of the demographic
parameters of the models can arise through sampling variation, and we suspect
that the resulting measurement error can strongly affect both the interpretability of
a risk analysis and any estimate of the uncertainty that it involves. With measurement error, it is not clear a priori how far into the future a population can be validly
projected. The need for separate treatments of the two kinds of uncertainties has
been stressed by Ferson and Ginzburg (1996).
In this chapter, we illustrate how the effects of measurement error can be
incorporated into an extinction risk assessment for the Northern Spotted Owl
(Strix occidentalis caurina) on the Olympic Peninsula. In analyzing the level of
risk for this owl population under different scenarios, we examined the effects of
different availabilities of suitable habitat and the effects of infrequent catastrophes, as well as the relative effects of environmental variability and measurement error. In incorporating measurement error into our analysis of extinction
risk, we included the effects of uncertainty about the average demographic rates
given the observed range of environmental variability. The Northern Spotted Owl
provides a good case for developing these principles because it is fairly typical of
applications of extinction risk assessment: despite years of attention and data
collection, considerable uncertainty still persists about the demographic rates of
each population and about the processes that determine those rates.
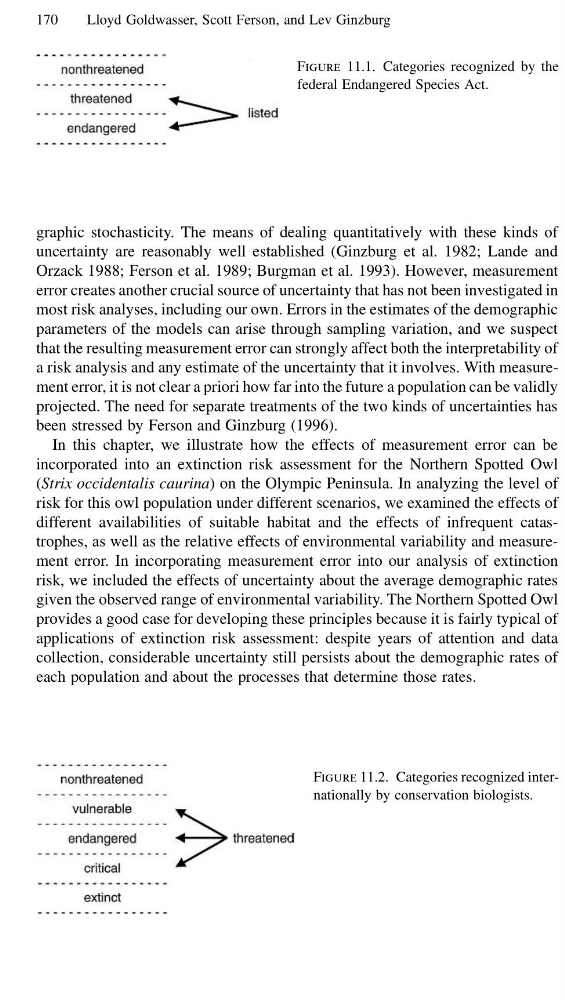
Figure 11.2. Categories recognized internationally by conservation biologists.
Lloyd Goldwasser, Scott Ferson, and Lev Ginzburg
Figure 11.1. Categories recognized by the
federal Endangered Species Act.
graphic stochasticity. The means of dealing quantitatively with these kinds of
uncertainty are reasonably well established (Ginzburg et al. 1982; Lande and
Orzack 1988; Ferson et al. 1989; Burgman et al. 1993). However, measurement
error creates another crucial source of uncertainty that has not been investigated in
most risk analyses, including our own. Errors in the estimates of the demographic
parameters of the models can arise through sampling variation, and we suspect
that the resulting measurement error can strongly affect both the interpretability of
a risk analysis and any estimate of the uncertainty that it involves. With measurement error, it is not clear a priori how far into the future a population can be validly
projected. The need for separate treatments of the two kinds of uncertainties has
been stressed by Ferson and Ginzburg (1996).
In this chapter, we illustrate how the effects of measurement error can be
incorporated into an extinction risk assessment for the Northern Spotted Owl
(Strix occidentalis caurina) on the Olympic Peninsula. In analyzing the level of
risk for this owl population under different scenarios, we examined the effects of
different availabilities of suitable habitat and the effects of infrequent catastrophes, as well as the relative effects of environmental variability and measurement error. In incorporating measurement error into our analysis of extinction
risk, we included the effects of uncertainty about the average demographic rates
given the observed range of environmental variability. The Northern Spotted Owl
provides a good case for developing these principles because it is fairly typical of
applications of extinction risk assessment: despite years of attention and data
collection, considerable uncertainty still persists about the demographic rates of
each population and about the processes that determine those rates.
Figure 11.2. Categories recognized internationally by conservation biologists.