

9. Assessing Land-Use Impacts on Bull Trout Using Bayesian Belief Networks
141
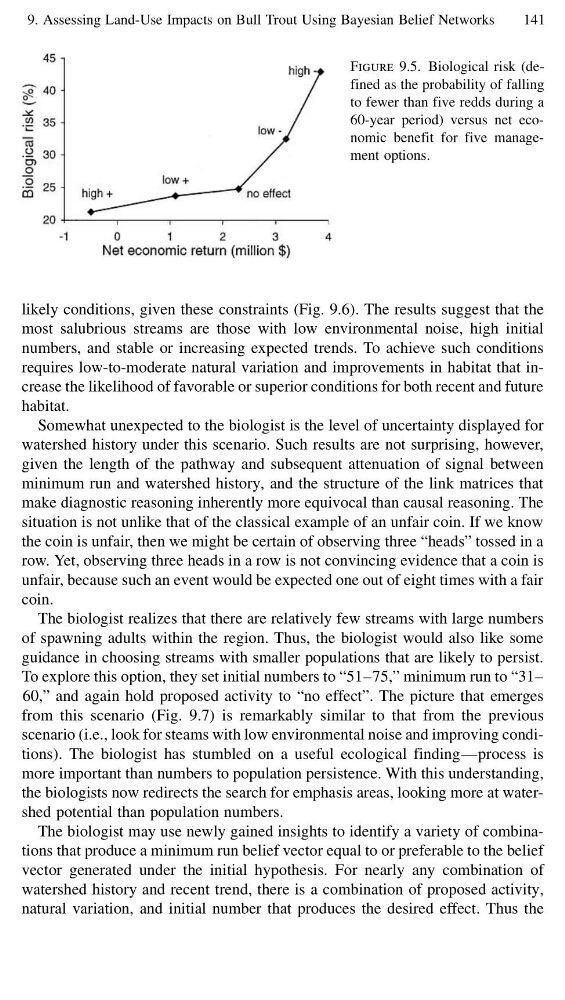
Figure 9.5. Biological risk (defined as the probability of falling
to fewer than five redds during a
60-year period) versus net economic benefit for five management options.
likely conditions, given these constraints (Fig. 9.6). The results suggest that the
most salubrious streams are those with low environmental noise, high initial
numbers, and stable or increasing expected trends. To achieve such conditions
requires low-to-moderate natural variation and improvements in habitat that increase the likelihood of favorable or superior conditions for both recent and future
habitat.
Somewhat unexpected to the biologist is the level of uncertainty displayed for
watershed history under this scenario. Such results are not surprising, however,
given the length of the pathway and subsequent attenuation of signal between
minimum run and watershed history, and the structure of the link matrices that
make diagnostic reasoning inherently more equivocal than causal reasoning. The
situation is not unlike that of the classical example of an unfair coin. If we know
the coin is unfair, then we might be certain of observing three “heads” tossed in a
row. Yet, observing three heads in a row is not convincing evidence that a coin is
unfair, because such an event would be expected one out of eight times with a fair
coin.
The biologist realizes that there are relatively few streams with large numbers
of spawning adults within the region. Thus, the biologist would also like some
guidance in choosing streams with smaller populations that are likely to persist.
To explore this option, they set initial numbers to “51–75,” minimum run to “31–
60,” and again hold proposed activity to “no effect”. The picture that emerges
from this scenario (Fig. 9.7) is remarkably similar to that from the previous
scenario (i.e., look for steams with low environmental noise and improving conditions). The biologist has stumbled on a useful ecological finding—process is
more important than numbers to population persistence. With this understanding,
the biologists now redirects the search for emphasis areas, looking more at watershed potential than population numbers.
The biologist may use newly gained insights to identify a variety of combinations that produce a minimum run belief vector equal to or preferable to the belief
vector generated under the initial hypothesis. For nearly any combination of
watershed history and recent trend, there is a combination of proposed activity,
natural variation, and initial number that produces the desired effect. Thus the
141
Figure 9.5. Biological risk (defined as the probability of falling
to fewer than five redds during a
60-year period) versus net economic benefit for five management options.
likely conditions, given these constraints (Fig. 9.6). The results suggest that the
most salubrious streams are those with low environmental noise, high initial
numbers, and stable or increasing expected trends. To achieve such conditions
requires low-to-moderate natural variation and improvements in habitat that increase the likelihood of favorable or superior conditions for both recent and future
habitat.
Somewhat unexpected to the biologist is the level of uncertainty displayed for
watershed history under this scenario. Such results are not surprising, however,
given the length of the pathway and subsequent attenuation of signal between
minimum run and watershed history, and the structure of the link matrices that
make diagnostic reasoning inherently more equivocal than causal reasoning. The
situation is not unlike that of the classical example of an unfair coin. If we know
the coin is unfair, then we might be certain of observing three “heads” tossed in a
row. Yet, observing three heads in a row is not convincing evidence that a coin is
unfair, because such an event would be expected one out of eight times with a fair
coin.
The biologist realizes that there are relatively few streams with large numbers
of spawning adults within the region. Thus, the biologist would also like some
guidance in choosing streams with smaller populations that are likely to persist.
To explore this option, they set initial numbers to “51–75,” minimum run to “31–
60,” and again hold proposed activity to “no effect”. The picture that emerges
from this scenario (Fig. 9.7) is remarkably similar to that from the previous
scenario (i.e., look for steams with low environmental noise and improving conditions). The biologist has stumbled on a useful ecological finding—process is
more important than numbers to population persistence. With this understanding,
the biologists now redirects the search for emphasis areas, looking more at watershed potential than population numbers.
The biologist may use newly gained insights to identify a variety of combinations that produce a minimum run belief vector equal to or preferable to the belief
vector generated under the initial hypothesis. For nearly any combination of
watershed history and recent trend, there is a combination of proposed activity,
natural variation, and initial number that produces the desired effect. Thus the