

8. Whaling Models for Cetacean Conservation
113
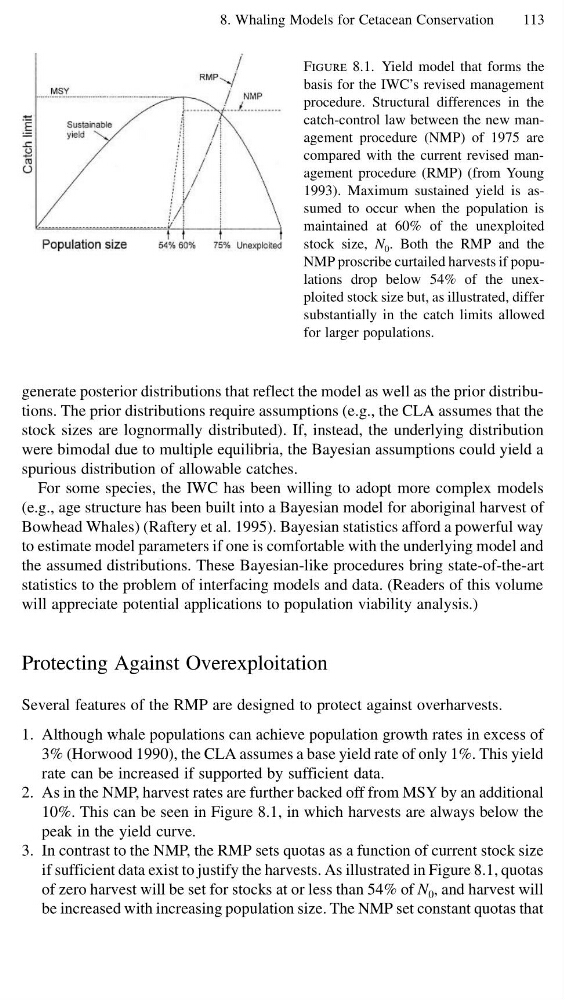
Figure 8.1. Yield model that forms the
basis for the IWC’s revised management
procedure. Structural differences in the
catch-control law between the new management procedure (NMP) of 1975 are
compared with the current revised management procedure (RMP) (from Young
1993). Maximum sustained yield is assumed to occur when the population is
maintained at 60% of the unexploited
stock size, N 0 . Both the RMP and the
NMP proscribe curtailed harvests if populations drop below 54% of the unexploited stock size but, as illustrated, differ
substantially in the catch limits allowed
for larger populations.
generate posterior distributions that reflect the model as well as the prior distributions. The prior distributions require assumptions (e.g., the CLA assumes that the
stock sizes are lognormally distributed). If, instead, the underlying distribution
were bimodal due to multiple equilibria, the Bayesian assumptions could yield a
spurious distribution of allowable catches.
For some species, the IWC has been willing to adopt more complex models
(e.g., age structure has been built into a Bayesian model for aboriginal harvest of
Bowhead Whales) (Raftery et al. 1995). Bayesian statistics afford a powerful way
to estimate model parameters if one is comfortable with the underlying model and
the assumed distributions. These Bayesian-like procedures bring state-of-the-art
statistics to the problem of interfacing models and data. (Readers of this volume
will appreciate potential applications to population viability analysis.)
Protecting Against Overexploitation
Several features of the RMP are designed to protect against overharvests.
1. Although whale populations can achieve population growth rates in excess of
3% (Horwood 1990), the CLA assumes a base yield rate of only 1%. This yield
rate can be increased if supported by sufficient data.
2. As in the NMP, harvest rates are further backed off from MSY by an additional
10%. This can be seen in Figure 8.1, in which harvests are always below the
peak in the yield curve.
3. In contrast to the NMP, the RMP sets quotas as a function of current stock size
if sufficient data exist to justify the harvests. As illustrated in Figure 8.1, quotas
of zero harvest will be set for stocks at or less than 54% of N 0 , and harvest will
be increased with increasing population size. The NMP set constant quotas that
113
Figure 8.1. Yield model that forms the
basis for the IWC’s revised management
procedure. Structural differences in the
catch-control law between the new management procedure (NMP) of 1975 are
compared with the current revised management procedure (RMP) (from Young
1993). Maximum sustained yield is assumed to occur when the population is
maintained at 60% of the unexploited
stock size, N 0 . Both the RMP and the
NMP proscribe curtailed harvests if populations drop below 54% of the unexploited stock size but, as illustrated, differ
substantially in the catch limits allowed
for larger populations.
generate posterior distributions that reflect the model as well as the prior distributions. The prior distributions require assumptions (e.g., the CLA assumes that the
stock sizes are lognormally distributed). If, instead, the underlying distribution
were bimodal due to multiple equilibria, the Bayesian assumptions could yield a
spurious distribution of allowable catches.
For some species, the IWC has been willing to adopt more complex models
(e.g., age structure has been built into a Bayesian model for aboriginal harvest of
Bowhead Whales) (Raftery et al. 1995). Bayesian statistics afford a powerful way
to estimate model parameters if one is comfortable with the underlying model and
the assumed distributions. These Bayesian-like procedures bring state-of-the-art
statistics to the problem of interfacing models and data. (Readers of this volume
will appreciate potential applications to population viability analysis.)
Protecting Against Overexploitation
Several features of the RMP are designed to protect against overharvests.
1. Although whale populations can achieve population growth rates in excess of
3% (Horwood 1990), the CLA assumes a base yield rate of only 1%. This yield
rate can be increased if supported by sufficient data.
2. As in the NMP, harvest rates are further backed off from MSY by an additional
10%. This can be seen in Figure 8.1, in which harvests are always below the
peak in the yield curve.
3. In contrast to the NMP, the RMP sets quotas as a function of current stock size
if sufficient data exist to justify the harvests. As illustrated in Figure 8.1, quotas
of zero harvest will be set for stocks at or less than 54% of N 0 , and harvest will
be increased with increasing population size. The NMP set constant quotas that