

106
Barbara L. Taylor and Paul R. Wade
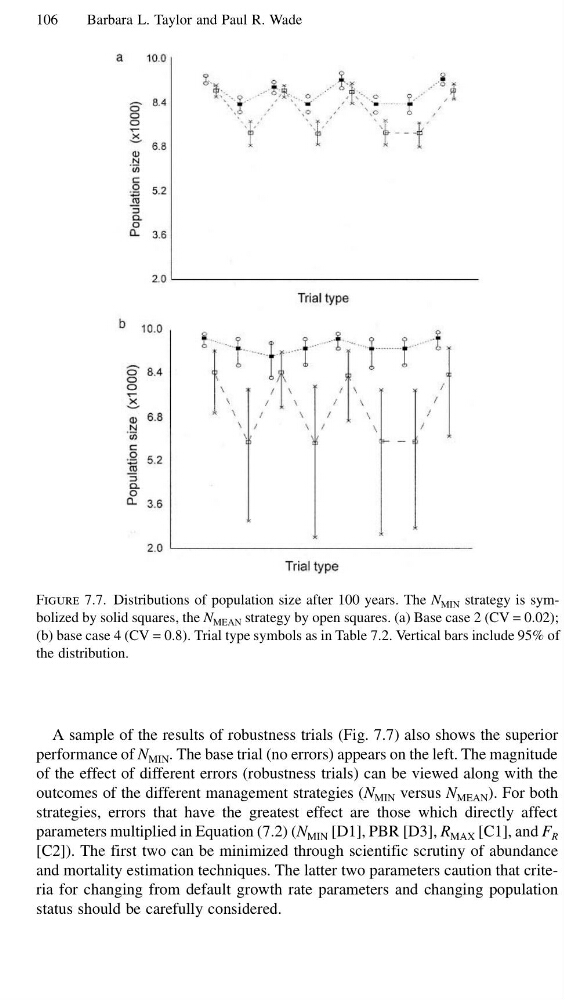
Figure 7.7. Distributions of population size after 100 years. The N MIN strategy is symbolized by solid squares, the N MEAN strategy by open squares. (a) Base case 2 (CV = 0.02);
(b) base case 4 (CV = 0.8). Trial type symbols as in Table 7.2. Vertical bars include 95% of
the distribution.
A sample of the results of robustness trials (Fig. 7.7) also shows the superior
performance of N MIN . The base trial (no errors) appears on the left. The magnitude
of the effect of different errors (robustness trials) can be viewed along with the
outcomes of the different management strategies (N MIN versus N MEAN ). For both
strategies, errors that have the greatest effect are those which directly affect
parameters multiplied in Equation (7.2) (N MIN [D1], PBR [D3], R MAX [C1], and F R
[C2]). The first two can be minimized through scientific scrutiny of abundance
and mortality estimation techniques. The latter two parameters caution that criteria for changing from default growth rate parameters and changing population
status should be carefully considered.
Barbara L. Taylor and Paul R. Wade
Figure 7.7. Distributions of population size after 100 years. The N MIN strategy is symbolized by solid squares, the N MEAN strategy by open squares. (a) Base case 2 (CV = 0.02);
(b) base case 4 (CV = 0.8). Trial type symbols as in Table 7.2. Vertical bars include 95% of
the distribution.
A sample of the results of robustness trials (Fig. 7.7) also shows the superior
performance of N MIN . The base trial (no errors) appears on the left. The magnitude
of the effect of different errors (robustness trials) can be viewed along with the
outcomes of the different management strategies (N MIN versus N MEAN ). For both
strategies, errors that have the greatest effect are those which directly affect
parameters multiplied in Equation (7.2) (N MIN [D1], PBR [D3], R MAX [C1], and F R
[C2]). The first two can be minimized through scientific scrutiny of abundance
and mortality estimation techniques. The latter two parameters caution that criteria for changing from default growth rate parameters and changing population
status should be carefully considered.