

346
D. Raffaelli and M. Emmerson
10"
1()2
10-1
10-2
0.5
1
2
4
8
16 32 64 125 250 500 1
2
4
8
16 32
()lIn)
(mm)
equivalent spherical diameter
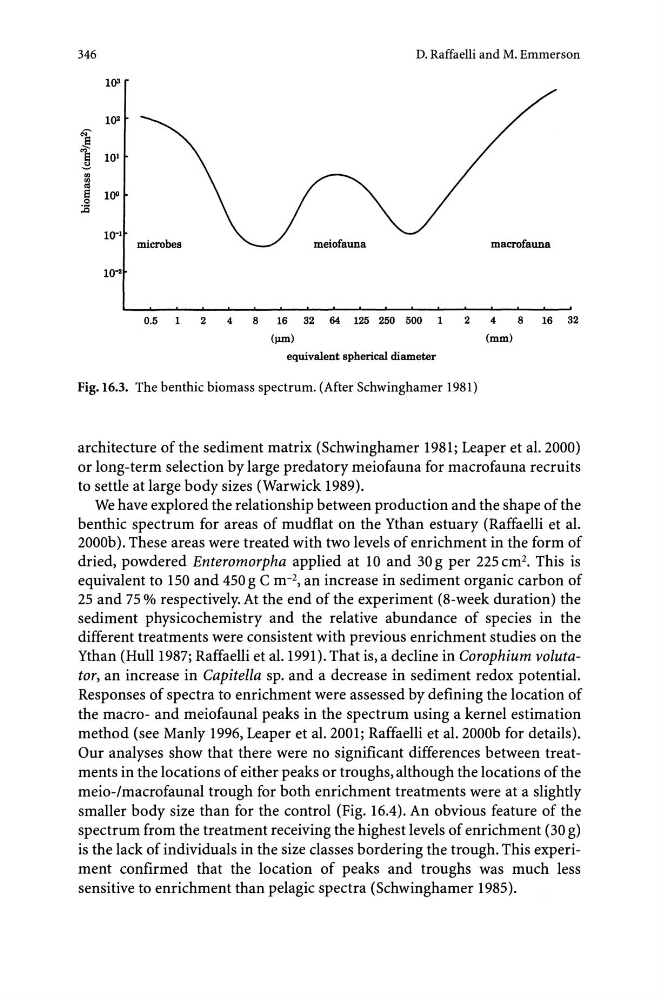
Fig.16.3. The benthic biomass spectrum. (After Schwinghamer 1981)
architecture of the sediment matrix (Schwinghamer 1981; Leaper et al. 2000)
or long-term selection by large predatory meiofauna for macrofauna recruits
to settle at large body sizes (Warwick 1989).
We have explored the relationship between production and the shape of the
benthic spectrum for areas of mudflat on the Ythan estuary (Raffaelli et al.
2000b). These areas were treated with two levels of enrichment in the form of
dried, powdered Enteromorpha applied at 10 and 30 g per 225 cm 2 • This is
equivalent to 150 and 450 g C m- 2 , an increase in sediment organic carbon of
25 and 75 % respectively. At the end of the experiment (8-week duration) the
sediment physico chemistry and the relative abundance of species in the
different treatments were consistent with previous enrichment studies on the
Ythan (Hull 1987; Raffaelli et al. 1991). That is, a decline in Corophium volutator, an increase in Capitella sp. and a decrease in sediment redox potential.
Responses of spectra to enrichment were assessed by defining the location of
the macro- and meiofaunal peaks in the spectrum using a kernel estimation
method (see Manly 1996, Leaper et al. 2001; Raffaelli et al. 2000b for details).
Our analyses show that there were no significant differences between treatments in the locations of either peaks or troughs, although the locations of the
meio-/macrofaunal trough for both enrichment treatments were at a slightly
smaller body size than for the control (Fig. 16.4). An obvious feature of the
spectrum from the treatment receiving the highest levels of enrichment (30 g)
is the lack of individuals in the size classes bordering the trough. This experiment confirmed that the location of peaks and troughs was much less
sensitive to enrichment than pelagic spectra (Schwinghamer 1985).
D. Raffaelli and M. Emmerson
10"
1()2
10-1
10-2
0.5
1
2
4
8
16 32 64 125 250 500 1
2
4
8
16 32
()lIn)
(mm)
equivalent spherical diameter
Fig.16.3. The benthic biomass spectrum. (After Schwinghamer 1981)
architecture of the sediment matrix (Schwinghamer 1981; Leaper et al. 2000)
or long-term selection by large predatory meiofauna for macrofauna recruits
to settle at large body sizes (Warwick 1989).
We have explored the relationship between production and the shape of the
benthic spectrum for areas of mudflat on the Ythan estuary (Raffaelli et al.
2000b). These areas were treated with two levels of enrichment in the form of
dried, powdered Enteromorpha applied at 10 and 30 g per 225 cm 2 • This is
equivalent to 150 and 450 g C m- 2 , an increase in sediment organic carbon of
25 and 75 % respectively. At the end of the experiment (8-week duration) the
sediment physico chemistry and the relative abundance of species in the
different treatments were consistent with previous enrichment studies on the
Ythan (Hull 1987; Raffaelli et al. 1991). That is, a decline in Corophium volutator, an increase in Capitella sp. and a decrease in sediment redox potential.
Responses of spectra to enrichment were assessed by defining the location of
the macro- and meiofaunal peaks in the spectrum using a kernel estimation
method (see Manly 1996, Leaper et al. 2001; Raffaelli et al. 2000b for details).
Our analyses show that there were no significant differences between treatments in the locations of either peaks or troughs, although the locations of the
meio-/macrofaunal trough for both enrichment treatments were at a slightly
smaller body size than for the control (Fig. 16.4). An obvious feature of the
spectrum from the treatment receiving the highest levels of enrichment (30 g)
is the lack of individuals in the size classes bordering the trough. This experiment confirmed that the location of peaks and troughs was much less
sensitive to enrichment than pelagic spectra (Schwinghamer 1985).