

344
D. Raffaelli and M. Emmerson
life-history traits and variation in the living space made available by the depth
of the chemocline, but the empirical pattern of body size is consistent and
compelling. However, there have been surprisingly direct experimental tests
of the effects of increased system production on body-size distributions in
marine benthic assemblages. In this section, we describe two related conceptual approaches - constraint space plots and biomass spectra - that have
recently been applied to the Ythan system, and assess their utility for
examining the relationship between production and body size. The two
approaches are similar in that they both involve plots of body size against
abundance, but differ in their representation as a consequence of their different origins in terrestrial and marine ecology respectively.
16.3.1 Constraint Space Plots
Much of the research on the relationship between abundance and body size
comes from terrestrial systems (Brown and Maurer 1986; Gaston and Lawton
1988; Lawton 1989,1990; Cotgreave 1993; Blackburn and Gaston 1994, 1997,
1999), although there have been a few freshwater (Strayer 1994; Cyr et al.
1997a,b) and one rocky shore (Navarette and Menge 1997) study. A potentially
useful summary plot of such data from entire communities is the constraint
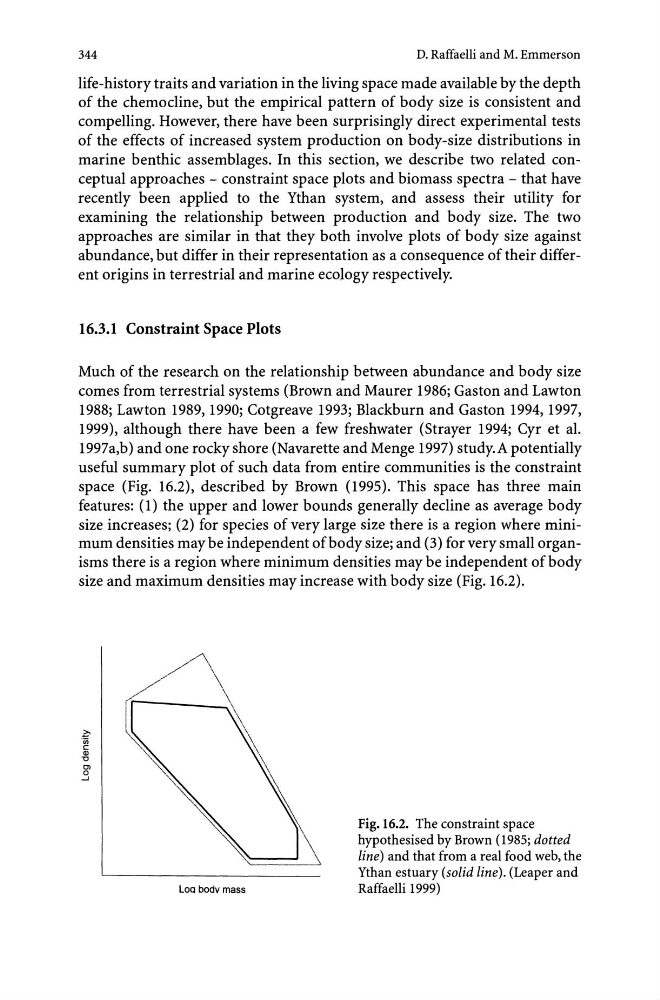
space (Fig. 16.2), described by Brown (1995). This space has three main
features: (1) the upper and lower bounds generally decline as average body
size increases; (2) for species of very large size there is a region where minimum densities may be independent of body size; and (3) for very small organisms there is a region where minimum densities may be independent of body
size and maximum densities may increase with body size (Fig. 16.2) .
i!'
.iij
co
"
u
'" o
..J
. /'\
/
\
/ '
\
r;../
\.
.
\
~\
~
\
"
\
~
\
'\::_---------~\
Loo body mass
Fig. 16.2. The constraint space
hypothesised by Brown (1985; dotted
line) and that from a real food web, the
Ythan estuary (solid line). (Leaper and
Raffaelli 1999)
D. Raffaelli and M. Emmerson
life-history traits and variation in the living space made available by the depth
of the chemocline, but the empirical pattern of body size is consistent and
compelling. However, there have been surprisingly direct experimental tests
of the effects of increased system production on body-size distributions in
marine benthic assemblages. In this section, we describe two related conceptual approaches - constraint space plots and biomass spectra - that have
recently been applied to the Ythan system, and assess their utility for
examining the relationship between production and body size. The two
approaches are similar in that they both involve plots of body size against
abundance, but differ in their representation as a consequence of their different origins in terrestrial and marine ecology respectively.
16.3.1 Constraint Space Plots
Much of the research on the relationship between abundance and body size
comes from terrestrial systems (Brown and Maurer 1986; Gaston and Lawton
1988; Lawton 1989,1990; Cotgreave 1993; Blackburn and Gaston 1994, 1997,
1999), although there have been a few freshwater (Strayer 1994; Cyr et al.
1997a,b) and one rocky shore (Navarette and Menge 1997) study. A potentially
useful summary plot of such data from entire communities is the constraint
space (Fig. 16.2), described by Brown (1995). This space has three main
features: (1) the upper and lower bounds generally decline as average body
size increases; (2) for species of very large size there is a region where minimum densities may be independent of body size; and (3) for very small organisms there is a region where minimum densities may be independent of body
size and maximum densities may increase with body size (Fig. 16.2) .
i!'
.iij
co
"
u
'" o
..J
. /'\
/
\
/ '
\
r;../
\.
.
\
~\
~
\
"
\
~
\
'\::_---------~\
Loo body mass
Fig. 16.2. The constraint space
hypothesised by Brown (1985; dotted
line) and that from a real food web, the
Ythan estuary (solid line). (Leaper and
Raffaelli 1999)