

282
s. Dittmann and J.A. Vargas
various levels, as not all phyla were studied to the same extent and taxonomic
work is still continuing. Based on all macrobenthic invertebrates, Table 13.2
shows that dissimilarities start at the family level (QS=O.68) and the two sides
of the Pacific had few genera and no species in common. For Polychaeta, the
similarity was still very high at the family level, but here, too, no species
occurred both in Australia and Central America.
13.3.3 Individual Abundances
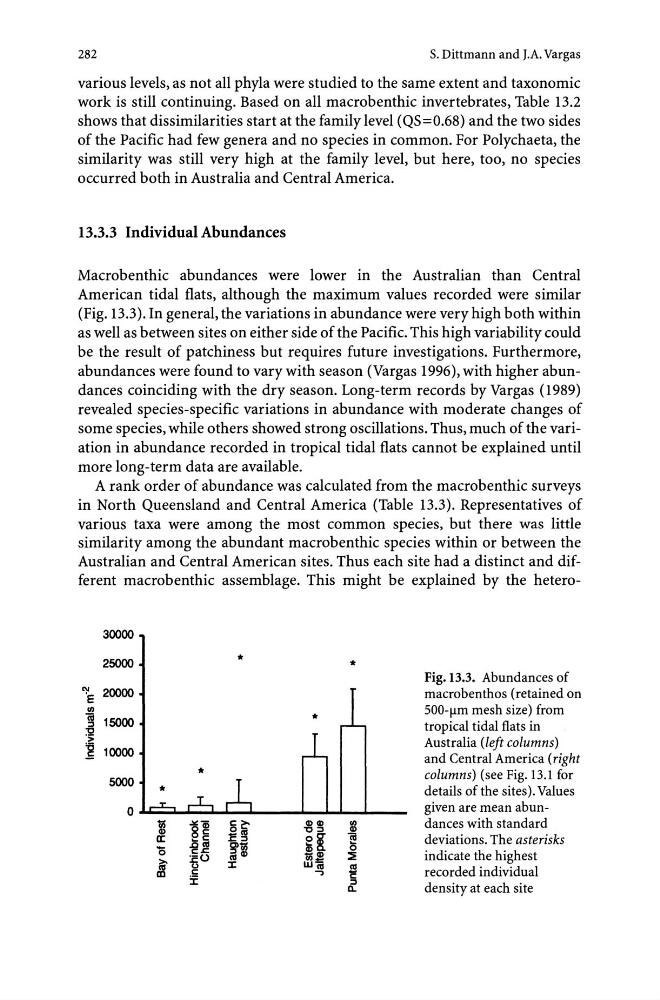
Macrobenthic abundances were lower in the Australian than Central
American tidal flats, although the maximum values recorded were similar
(Fig. 13.3). In general, the variations in abundance were very high both within
as well as between sites on either side of the Pacific. This high variability could
be the result of patchiness but requires future investigations. Furthermore,
abundances were found to vary with season (Vargas 1996), with higher abundances coinciding with the dry season. Long-term records by Vargas (1989)
revealed species-specific variations in abundance with moderate changes of
some species, while others showed strong oscillations. Thus, much of the variation in abundance recorded in tropical tidal flats cannot be explained until
more long-term data are available.
A rank order of abundance was calculated from the macrobenthic surveys
in North Queensland and Central America (Table 13.3). Representatives of
various taxa were among the most common species, but there was little
similarity among the abundant macrobenthic species within or between the
Australian and Central American sites. Thus each site had a distinct and different macrobenthic assemblage. This might be explained by the hetero30000
25000
*
*
Fig. 13.3. Abundances of
~
20000
macrobenthos (retained on
E
iii
*
::l 15000
tropical tidal flats in
:2
>
Australia (left columns)
~ 10000
and Central America (right
*
columns) (see Fig.13.l for
5000
details of the sites). Values
0
given are mean abun'Iii
8~
§~
~~
Q)
Q)
a::
~c
.c~
e§:
iii
deviations. The asterisks
15
.ora
g>'Iii
15
c.<=
~~
indicate the highest
:EO
raQ)
::E
~
(.)
:I:
Wiii
ra
recorded individual
m
.s:
....,
C
:I:
::l
density at each site
0..
s. Dittmann and J.A. Vargas
various levels, as not all phyla were studied to the same extent and taxonomic
work is still continuing. Based on all macrobenthic invertebrates, Table 13.2
shows that dissimilarities start at the family level (QS=O.68) and the two sides
of the Pacific had few genera and no species in common. For Polychaeta, the
similarity was still very high at the family level, but here, too, no species
occurred both in Australia and Central America.
13.3.3 Individual Abundances
Macrobenthic abundances were lower in the Australian than Central
American tidal flats, although the maximum values recorded were similar
(Fig. 13.3). In general, the variations in abundance were very high both within
as well as between sites on either side of the Pacific. This high variability could
be the result of patchiness but requires future investigations. Furthermore,
abundances were found to vary with season (Vargas 1996), with higher abundances coinciding with the dry season. Long-term records by Vargas (1989)
revealed species-specific variations in abundance with moderate changes of
some species, while others showed strong oscillations. Thus, much of the variation in abundance recorded in tropical tidal flats cannot be explained until
more long-term data are available.
A rank order of abundance was calculated from the macrobenthic surveys
in North Queensland and Central America (Table 13.3). Representatives of
various taxa were among the most common species, but there was little
similarity among the abundant macrobenthic species within or between the
Australian and Central American sites. Thus each site had a distinct and different macrobenthic assemblage. This might be explained by the hetero30000
25000
*
*
Fig. 13.3. Abundances of
~
20000
macrobenthos (retained on
E
iii
*
::l 15000
tropical tidal flats in
:2
>
Australia (left columns)
~ 10000
and Central America (right
*
columns) (see Fig.13.l for
5000
details of the sites). Values
0
given are mean abun'Iii
8~
§~
~~
Q)
Q)
a::
~c
.c~
e§:
iii
deviations. The asterisks
15
.ora
g>'Iii
15
c.<=
~~
indicate the highest
:EO
raQ)
::E
~
(.)
:I:
Wiii
ra
recorded individual
m
.s:
....,
C
:I:
::l
density at each site
0..