

The Leaf Canopy of Seagrass Beds: Faunal Community in a Salinity Gradient
215
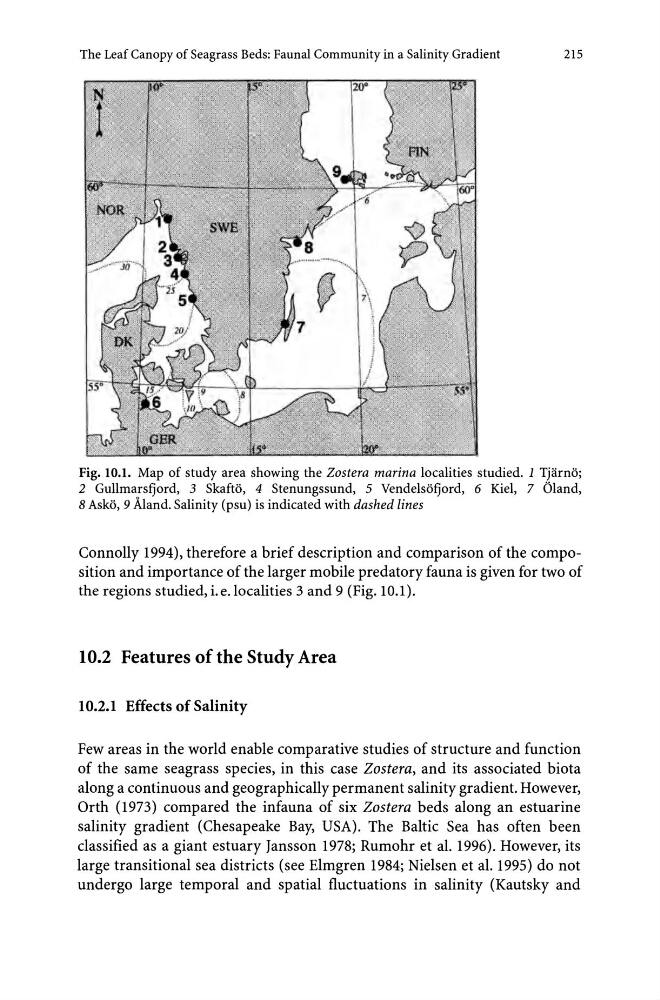
Fig. 10.1. Map of study area showing the Zostera marina localities studied. 1 Tjarno;
2 Gullmarsfjord, 3 Skafto, 4 Stenungssund, 5 Vendelsofjord, 6 Kiel, 7 Oland,
8 Asko, 9 Aland. Salinity (psu) is indicated with dashed lines
Connolly 1994), therefore a brief description and comparison of the composition and importance of the larger mobile predatory fauna is given for two of
the regions studied, i. e.localities 3 and 9 (Fig. 10.1).
10.2 Features of the Study Area
10.2.1 Effects of Salinity
Few areas in the world enable comparative studies of structure and function
of the same seagrass species, in this case Zostera, and its associated biota
along a continuous and geographically permanent salinity gradient. However,
Orth (1973) compared the infauna of six Zostera beds along an estuarine
salinity gradient (Chesapeake Bay, USA). The Baltic Sea has often been
classified as a giant estuary Jansson 1978; Rumohr et al. 1996), However, its
large transitional sea districts (see Elmgren 1984; Nielsen et al. 1995) do not
undergo large temporal and spatial fluctuations in salinity (Kautsky and
215
Fig. 10.1. Map of study area showing the Zostera marina localities studied. 1 Tjarno;
2 Gullmarsfjord, 3 Skafto, 4 Stenungssund, 5 Vendelsofjord, 6 Kiel, 7 Oland,
8 Asko, 9 Aland. Salinity (psu) is indicated with dashed lines
Connolly 1994), therefore a brief description and comparison of the composition and importance of the larger mobile predatory fauna is given for two of
the regions studied, i. e.localities 3 and 9 (Fig. 10.1).
10.2 Features of the Study Area
10.2.1 Effects of Salinity
Few areas in the world enable comparative studies of structure and function
of the same seagrass species, in this case Zostera, and its associated biota
along a continuous and geographically permanent salinity gradient. However,
Orth (1973) compared the infauna of six Zostera beds along an estuarine
salinity gradient (Chesapeake Bay, USA). The Baltic Sea has often been
classified as a giant estuary Jansson 1978; Rumohr et al. 1996), However, its
large transitional sea districts (see Elmgren 1984; Nielsen et al. 1995) do not
undergo large temporal and spatial fluctuations in salinity (Kautsky and