

154
10000
1000
100
10
o
10000
1000
100
10
Balgzand, summer 1991
a
...--.-. adult Arenicola
--0-- juv. Arenicola
?OOo · · 0 · ·juv. Macoma
.
0
o 0
'0':
, 0
o
'O~
9 0 'b .00'
'. ~
o·
'0
:.".
0
O"~
'.,' 0,
p' ".
o ~
cj 0
0". o~ ~
o .'
6
5
10
15
20
25
30
35
40
transect nr.
Balgzand, summer 1992
b
~
o "
?'o.ooo~
b
o~ "
' ..
' 6
::
5
10
o
.'
15
-+--adull Arenicola
--0-- juv. Arenicola
.. 0- •. juv. Macorna
o
• '0
p
:
,,00, 0 • ' 0
o~
? b o o b .
'0
: 0 0", 0 :
20
25
30
35
40
transect nr.
E, Flach and A. Tamaki
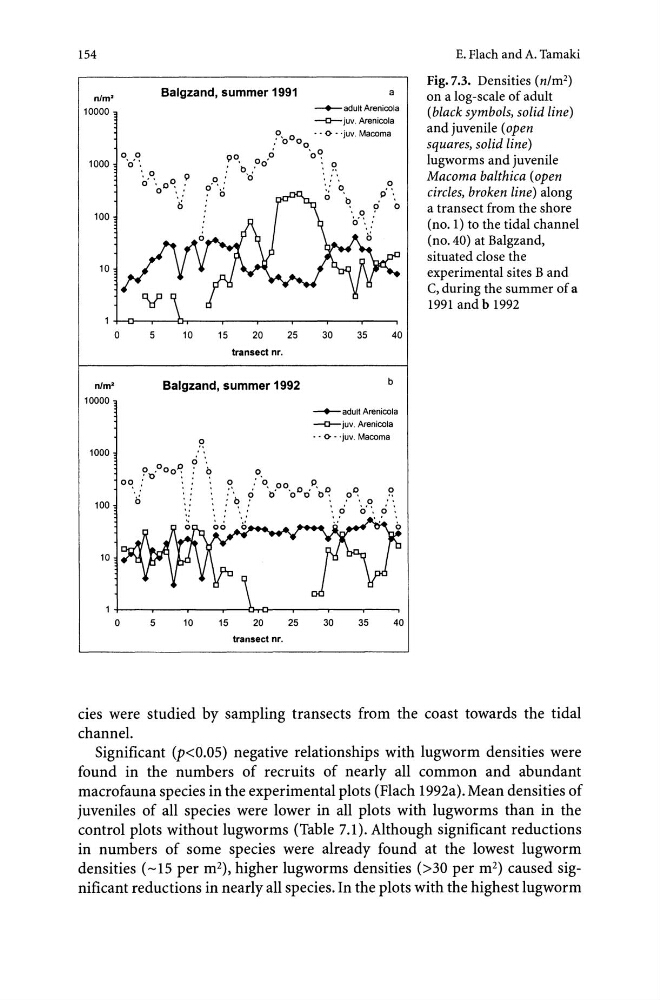
Fig. 7.3. Densities (nlm 2 )
on a log-scale of adult
(black symbols, solid line)
and juvenile (open
squares, solid line)
lugworms and juvenile
Macoma balthica (open
circles, broken line) along
a transect from the shore
(no. I) to the tidal channel
(no. 40) at Balgzand,
situated close the
experimental sites Band
C, during the summer of a
1991 and b 1992
cies were studied by sampling transects from the coast towards the tidal
channel.
Significant (p<0.05) negative relationships with lugworm densities were
found in the numbers of recruits of nearly all common and abundant
macrofauna species in the experimental plots (Flach 1992a). Mean densities of
juveniles of all species were lower in all plots with lugworms than in the
control plots without lugworms (Table 7.1). Although significant reductions
in numbers of some species were already found at the lowest lugworm
densities (-15 per m 2 ), higher lugworms densities (>30 per m 2 ) caused significant reductions in nearly all species. In the plots with the highest lugworm
10000
1000
100
10
o
10000
1000
100
10
Balgzand, summer 1991
a
...--.-. adult Arenicola
--0-- juv. Arenicola
?OOo · · 0 · ·juv. Macoma
.
0
o 0
'0':
, 0
o
'O~
9 0 'b .00'
'. ~
o·
'0
:.".
0
O"~
'.,' 0,
p' ".
o ~
cj 0
0". o~ ~
o .'
6
5
10
15
20
25
30
35
40
transect nr.
Balgzand, summer 1992
b
~
o "
?'o.ooo~
b
o~ "
' ..
' 6
::
5
10
o
.'
15
-+--adull Arenicola
--0-- juv. Arenicola
.. 0- •. juv. Macorna
o
• '0
p
:
,,00, 0 • ' 0
o~
? b o o b .
'0
: 0 0", 0 :
20
25
30
35
40
transect nr.
E, Flach and A. Tamaki
Fig. 7.3. Densities (nlm 2 )
on a log-scale of adult
(black symbols, solid line)
and juvenile (open
squares, solid line)
lugworms and juvenile
Macoma balthica (open
circles, broken line) along
a transect from the shore
(no. I) to the tidal channel
(no. 40) at Balgzand,
situated close the
experimental sites Band
C, during the summer of a
1991 and b 1992
cies were studied by sampling transects from the coast towards the tidal
channel.
Significant (p<0.05) negative relationships with lugworm densities were
found in the numbers of recruits of nearly all common and abundant
macrofauna species in the experimental plots (Flach 1992a). Mean densities of
juveniles of all species were lower in all plots with lugworms than in the
control plots without lugworms (Table 7.1). Although significant reductions
in numbers of some species were already found at the lowest lugworm
densities (-15 per m 2 ), higher lugworms densities (>30 per m 2 ) caused significant reductions in nearly all species. In the plots with the highest lugworm