

Model Simulation ofTemporal Variability of Suspended Matter in the North Sea
depth el/ereged
SPM concentretion
computed dala
7 5 I 5
8
722
6 5
8
"' '' t.h on. .eo.v,. ........
D o - 0.5
D 0 .5 - 1
mg/l
1 - 2
-
2 - 5
-
>6
or. noL lakan Ion\,.o
51
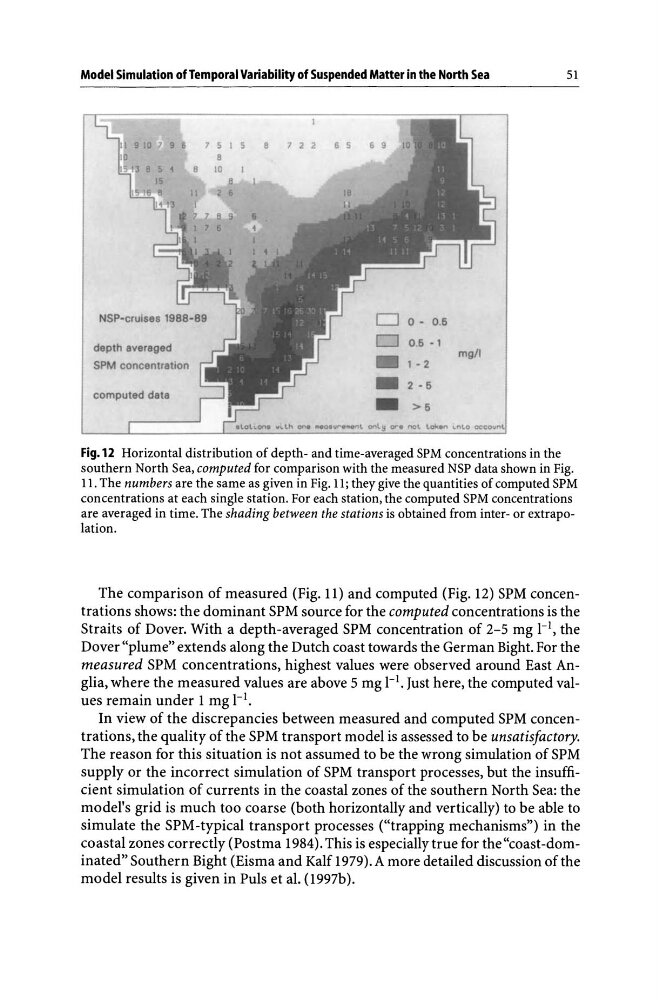
Fig.12 Horizontal distribution of depth- and time-averaged SPM concentrations in the
southern North Sea, computed for comparison with the measured NSP data shown in Fig.
11. The numbers are the same as given in Fig. 11; they give the quantities of computed SPM
concentrations at each single station. For each station, the computed SPM concentrations
are averaged in time. The shading between the stations is obtained from inter- or extrapolation.
The comparison of measured (Fig. 11) and computed (Fig. 12) SPM concentrations shows: the dominant SPM source for the computed concentrations is the
Straits of Dover. With a depth-averaged SPM concentration of 2-5 mg 1-1, the
Dover "plume" extends along the Dutch coast towards the German Bight. For the
measured SPM concentrations, highest values were observed around East Anglia, where the measured values are above 5 mg 1-1. Just here, the computed values remain under 1 mg 1-1.
In view of the discrepancies between measured and computed SPM concentrations, the quality of the SPM transport model is assessed to be unsatisfactory.
The reason for this situation is not assumed to be the wrong simulation of SPM
supply or the incorrect simulation of SPM transport processes, but the insufficient simulation of currents in the coastal zones of the southern North Sea: the
model's grid is much too coarse (both horizontally and vertically) to be able to
simulate the SPM-typical transport processes ("trapping mechanisms") in the
coastal zones correctly (Postma 1984). This is especially true for the "coast-dominated" Southern Bight (Eisma and Kalf 1979). A more detailed discussion of the
model results is given in PuIs et al. (l997b).
depth el/ereged
SPM concentretion
computed dala
7 5 I 5
8
722
6 5
8
"' '' t.h on. .eo.v,. ........
D o - 0.5
D 0 .5 - 1
mg/l
1 - 2
-
2 - 5
-
>6
or. noL lakan Ion\,.o
51
Fig.12 Horizontal distribution of depth- and time-averaged SPM concentrations in the
southern North Sea, computed for comparison with the measured NSP data shown in Fig.
11. The numbers are the same as given in Fig. 11; they give the quantities of computed SPM
concentrations at each single station. For each station, the computed SPM concentrations
are averaged in time. The shading between the stations is obtained from inter- or extrapolation.
The comparison of measured (Fig. 11) and computed (Fig. 12) SPM concentrations shows: the dominant SPM source for the computed concentrations is the
Straits of Dover. With a depth-averaged SPM concentration of 2-5 mg 1-1, the
Dover "plume" extends along the Dutch coast towards the German Bight. For the
measured SPM concentrations, highest values were observed around East Anglia, where the measured values are above 5 mg 1-1. Just here, the computed values remain under 1 mg 1-1.
In view of the discrepancies between measured and computed SPM concentrations, the quality of the SPM transport model is assessed to be unsatisfactory.
The reason for this situation is not assumed to be the wrong simulation of SPM
supply or the incorrect simulation of SPM transport processes, but the insufficient simulation of currents in the coastal zones of the southern North Sea: the
model's grid is much too coarse (both horizontally and vertically) to be able to
simulate the SPM-typical transport processes ("trapping mechanisms") in the
coastal zones correctly (Postma 1984). This is especially true for the "coast-dominated" Southern Bight (Eisma and Kalf 1979). A more detailed discussion of the
model results is given in PuIs et al. (l997b).