

44
9
6
3
0
9
6
3
0
W. Puis· T. Pohlmann· J. Siindermann
1 2 3 4 6 6 7 8 9 10111213141616171819202122232426262728293031
December 1988
9
6
3
0
9
6
3
0
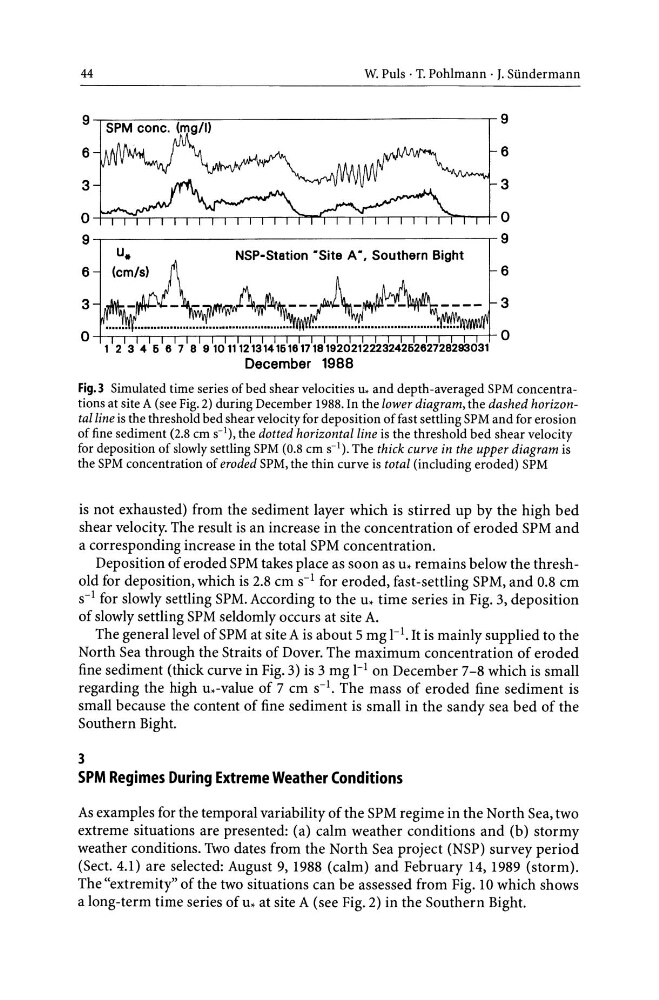
Fig.3 Simulated time series of bed shear velocities u. and depth-averaged SPM concentrations at site A (see Fig. 2) during December 1988. In the lower diagram, the dashed horizontal line is the threshold bed shear velocity for deposition of fast settling SPM and for erosion
of fine sediment (2.8 cm S-I), the dotted horizontal line is the threshold bed shear velocity
for deposition of slowly settling SPM (0.8 cm S-I). The thick curve in the upper diagram is
the SPM concentration of eroded SPM, the thin curve is total (including eroded) SPM
is not exhausted) from the sediment layer which is stirred up by the high bed
shear velocity. The result is an increase in the concentration of eroded SPM and
a corresponding increase in the total SPM concentration.
Deposition of eroded SPM takes place as soon as u. remains below the threshold for deposition, which is 2.8 cm S-1 for eroded, fast-settling SPM, and 0.8 cm
S-1 for slowly settling SPM. According to the u. time series in Fig. 3, deposition
of slowly settling SPM seldomly occurs at site A.
The general level of SPM at site A is about 5 mg 1-1. It is mainly supplied to the
North Sea through the Straits of Dover. The maximum concentration of eroded
fine sediment (thick curve in Fig. 3) is 3 mg I-Ion December 7-8 which is small
regarding the high u.-value of 7 cm s-l. The mass of eroded fine sediment is
small because the content of fine sediment is small in the sandy sea bed of the
Southern Bight.
3
SPM Regimes During Extreme Weather Conditions
As examples for the temporal variability of the SPM regime in the North Sea, two
extreme situations are presented: (a) calm weather conditions and (b) stormy
weather conditions. Two dates from the North Sea project (NSP) survey period
(Sect. 4.1) are selected: August 9, 1988 (calm) and February 14, 1989 (storm).
The "extremity" of the two situations can be assessed from Fig. 10 which shows
a long-term time series of u. at site A (see Fig. 2) in the Southern Bight.
9
6
3
0
9
6
3
0
W. Puis· T. Pohlmann· J. Siindermann
1 2 3 4 6 6 7 8 9 10111213141616171819202122232426262728293031
December 1988
9
6
3
0
9
6
3
0
Fig.3 Simulated time series of bed shear velocities u. and depth-averaged SPM concentrations at site A (see Fig. 2) during December 1988. In the lower diagram, the dashed horizontal line is the threshold bed shear velocity for deposition of fast settling SPM and for erosion
of fine sediment (2.8 cm S-I), the dotted horizontal line is the threshold bed shear velocity
for deposition of slowly settling SPM (0.8 cm S-I). The thick curve in the upper diagram is
the SPM concentration of eroded SPM, the thin curve is total (including eroded) SPM
is not exhausted) from the sediment layer which is stirred up by the high bed
shear velocity. The result is an increase in the concentration of eroded SPM and
a corresponding increase in the total SPM concentration.
Deposition of eroded SPM takes place as soon as u. remains below the threshold for deposition, which is 2.8 cm S-1 for eroded, fast-settling SPM, and 0.8 cm
S-1 for slowly settling SPM. According to the u. time series in Fig. 3, deposition
of slowly settling SPM seldomly occurs at site A.
The general level of SPM at site A is about 5 mg 1-1. It is mainly supplied to the
North Sea through the Straits of Dover. The maximum concentration of eroded
fine sediment (thick curve in Fig. 3) is 3 mg I-Ion December 7-8 which is small
regarding the high u.-value of 7 cm s-l. The mass of eroded fine sediment is
small because the content of fine sediment is small in the sandy sea bed of the
Southern Bight.
3
SPM Regimes During Extreme Weather Conditions
As examples for the temporal variability of the SPM regime in the North Sea, two
extreme situations are presented: (a) calm weather conditions and (b) stormy
weather conditions. Two dates from the North Sea project (NSP) survey period
(Sect. 4.1) are selected: August 9, 1988 (calm) and February 14, 1989 (storm).
The "extremity" of the two situations can be assessed from Fig. 10 which shows
a long-term time series of u. at site A (see Fig. 2) in the Southern Bight.