

438
o
I. Lerche· S. Cao . S. Mallory· K. Petersen· A. Lowrie
0+0 MaBP
Cumulative Probabilit~ «= Z)
20
40
60
80
100
O~~-L~~~~LL~~~~~-+
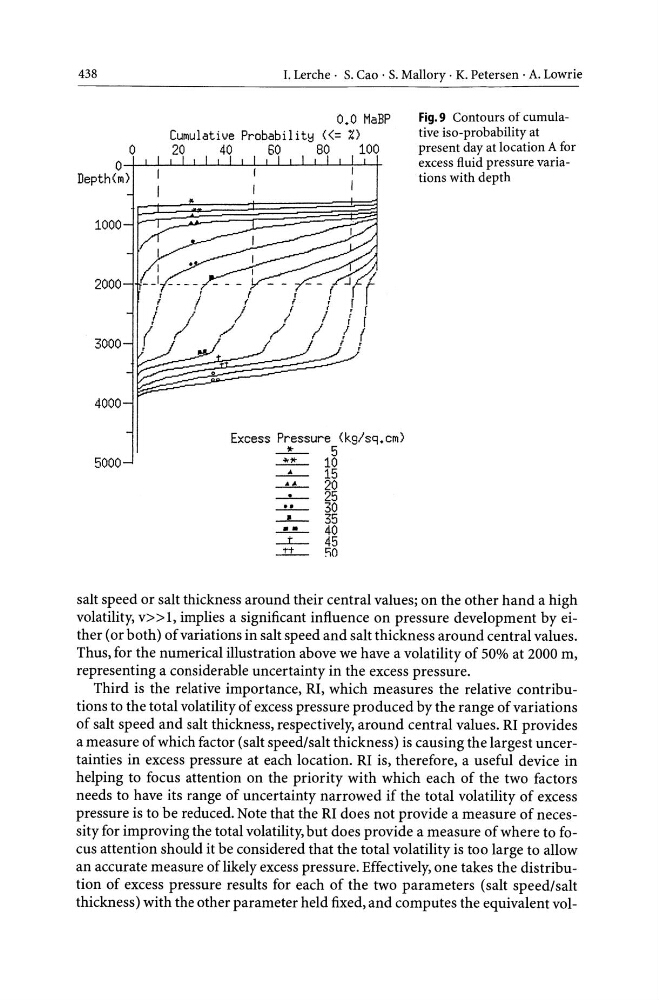
Fig.9 Contours of cumulative iso-probability at
present day at location A for
excess fluid pressure variations with depth
Depth(m)
1000
2000
3000
4000
5000
Excess Pressure (kg/sg+cm)
_It-_
5
~
10
-"- 15
....LL..20
_ 0 -
25
_0_'- 30
_a_ 35
~
40
-1:..- 45
-1::t...- [;)0
salt speed or salt thickness around their central values; on the other hand a high
volatility, v» 1, implies a significant influence on pressure development by either (or both) of variations in salt speed and salt thickness around central values.
Thus, for the numerical illustration above we have a volatility of 50% at 2000 m,
representing a considerable uncertainty in the excess pressure.
Third is the relative importance, RI, which measures the relative contributions to the total volatility of excess pressure produced by the range of variations
of salt speed and salt thickness, respectively, around central values. RI provides
a measure of which factor (salt speed/salt thickness) is causing the largest uncertainties in excess pressure at each location. RI is, therefore, a useful device in
helping to focus attention on the priority with which each of the two factors
needs to have its range of uncertainty narrowed if the total volatility of excess
pressure is to be reduced. Note that the RI does not provide a measure of necessity for improving the total volatility, but does provide a measure of where to focus attention should it be considered that the total volatility is too large to allow
an accurate measure oflikely excess pressure. Effectively, one takes the distribution of excess pressure results for each of the two parameters (salt speed/salt
thickness) with the other parameter held fixed, and computes the equivalent vol-
o
I. Lerche· S. Cao . S. Mallory· K. Petersen· A. Lowrie
0+0 MaBP
Cumulative Probabilit~ «= Z)
20
40
60
80
100
O~~-L~~~~LL~~~~~-+
Fig.9 Contours of cumulative iso-probability at
present day at location A for
excess fluid pressure variations with depth
Depth(m)
1000
2000
3000
4000
5000
Excess Pressure (kg/sg+cm)
_It-_
5
~
10
-"- 15
....LL..20
_ 0 -
25
_0_'- 30
_a_ 35
~
40
-1:..- 45
-1::t...- [;)0
salt speed or salt thickness around their central values; on the other hand a high
volatility, v» 1, implies a significant influence on pressure development by either (or both) of variations in salt speed and salt thickness around central values.
Thus, for the numerical illustration above we have a volatility of 50% at 2000 m,
representing a considerable uncertainty in the excess pressure.
Third is the relative importance, RI, which measures the relative contributions to the total volatility of excess pressure produced by the range of variations
of salt speed and salt thickness, respectively, around central values. RI provides
a measure of which factor (salt speed/salt thickness) is causing the largest uncertainties in excess pressure at each location. RI is, therefore, a useful device in
helping to focus attention on the priority with which each of the two factors
needs to have its range of uncertainty narrowed if the total volatility of excess
pressure is to be reduced. Note that the RI does not provide a measure of necessity for improving the total volatility, but does provide a measure of where to focus attention should it be considered that the total volatility is too large to allow
an accurate measure oflikely excess pressure. Effectively, one takes the distribution of excess pressure results for each of the two parameters (salt speed/salt
thickness) with the other parameter held fixed, and computes the equivalent vol-