

436
I. Lerche· S. Cao . S. Mallory· K. Petersen· A. Lowrie
Fourth, the dissolution of salt and the formation of collapse features, as well
as accommodation space creation by both salt motion and dissolution, are all influenced by lateral salt speed, salt thickness, and porosity retention in sub-salt
formations, leading to shifts in depositional and fluid-flow patterns.
Fifth, the lateral speed of salt can itself be influenced by the water content of
the sub-salt formations on which the salt mass glissades. A high porosity implies
less friction at the salt/sediment contact due to the lowering of contact viscosity
(as well as higher salt dissolution) than does a drier, more compacted, sub-salt
formation, thereby yielding a lowering of dynamic friction for salt motion
through sediments.
For all of these reasons it is important to be able to determine quantitatively
the degree of uncertainty of overpressure buildup in respect of magnitude, time
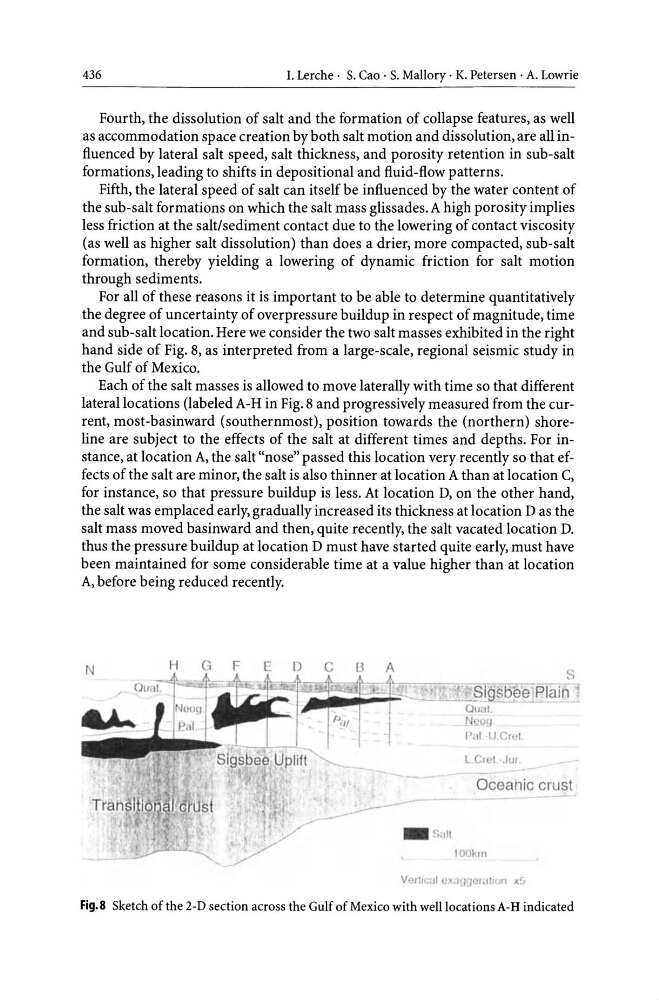
and sub-salt location. Here we consider the two salt masses exhibited in the right
hand side of Fig. 8, as interpreted from a large-scale, regional seismic study in
the Gulf of Mexico.
Each of the salt masses is allowed to move laterally with time so that different
lateral locations (labeled A-H in Fig. 8 and progressively measured from the current, most-basinward (southernmost), position towards the (northern) shoreline are subject to the effects of the salt at different times and depths. For instance, at location A, the salt "nose" passed this location very recently so that effects of the salt are minor, the salt is also thinner at location A than at location C,
for instance, so that pressure buildup is less. At location D, on the other hand,
the salt was emplaced early, gradually increased its thickness at location D as the
salt mass moved basinward and then, quite recently, the salt vacated location D.
thus the pressure buildup at location D must have started quite early, must have
been maintained for some considerable time at a value higher than at location
A, before being reduced recently.
--.... ;...--s
~igsbee -Plaih _
Qual.
NCU()
1';11 U CII'I
L C, I ·JUf
Oceanic crust
I~ ~ ~//
_ Salt
/
lOOk,,,
Vcrlu.:al c. d~mOrallCJn x!J
Fig.S Sketch of the 2-D section across the Gulf of Mexico with welllocationsA-H indicated
I. Lerche· S. Cao . S. Mallory· K. Petersen· A. Lowrie
Fourth, the dissolution of salt and the formation of collapse features, as well
as accommodation space creation by both salt motion and dissolution, are all influenced by lateral salt speed, salt thickness, and porosity retention in sub-salt
formations, leading to shifts in depositional and fluid-flow patterns.
Fifth, the lateral speed of salt can itself be influenced by the water content of
the sub-salt formations on which the salt mass glissades. A high porosity implies
less friction at the salt/sediment contact due to the lowering of contact viscosity
(as well as higher salt dissolution) than does a drier, more compacted, sub-salt
formation, thereby yielding a lowering of dynamic friction for salt motion
through sediments.
For all of these reasons it is important to be able to determine quantitatively
the degree of uncertainty of overpressure buildup in respect of magnitude, time
and sub-salt location. Here we consider the two salt masses exhibited in the right
hand side of Fig. 8, as interpreted from a large-scale, regional seismic study in
the Gulf of Mexico.
Each of the salt masses is allowed to move laterally with time so that different
lateral locations (labeled A-H in Fig. 8 and progressively measured from the current, most-basinward (southernmost), position towards the (northern) shoreline are subject to the effects of the salt at different times and depths. For instance, at location A, the salt "nose" passed this location very recently so that effects of the salt are minor, the salt is also thinner at location A than at location C,
for instance, so that pressure buildup is less. At location D, on the other hand,
the salt was emplaced early, gradually increased its thickness at location D as the
salt mass moved basinward and then, quite recently, the salt vacated location D.
thus the pressure buildup at location D must have started quite early, must have
been maintained for some considerable time at a value higher than at location
A, before being reduced recently.
--.... ;...--s
~igsbee -Plaih _
Qual.
NCU()
1';11 U CII'I
L C, I ·JUf
Oceanic crust
I~ ~ ~//
_ Salt
/
lOOk,,,
Vcrlu.:al c. d~mOrallCJn x!J
Fig.S Sketch of the 2-D section across the Gulf of Mexico with welllocationsA-H indicated