

Risk, Uncertainty and Priorities - Quantitative Models
WEST
-Ut-ALI K
A<>
Oil
EASI
S MEA!)E
........,---_...::t<> A'
I'IIANUSHU
GP
TOAOK FM .
Oil
181
759
1 e9
~[AP:D
e.r
~CA("£/~:
~
.~~.-.
(All a.plns are In meters)
.. ".~,.
NPRA
429
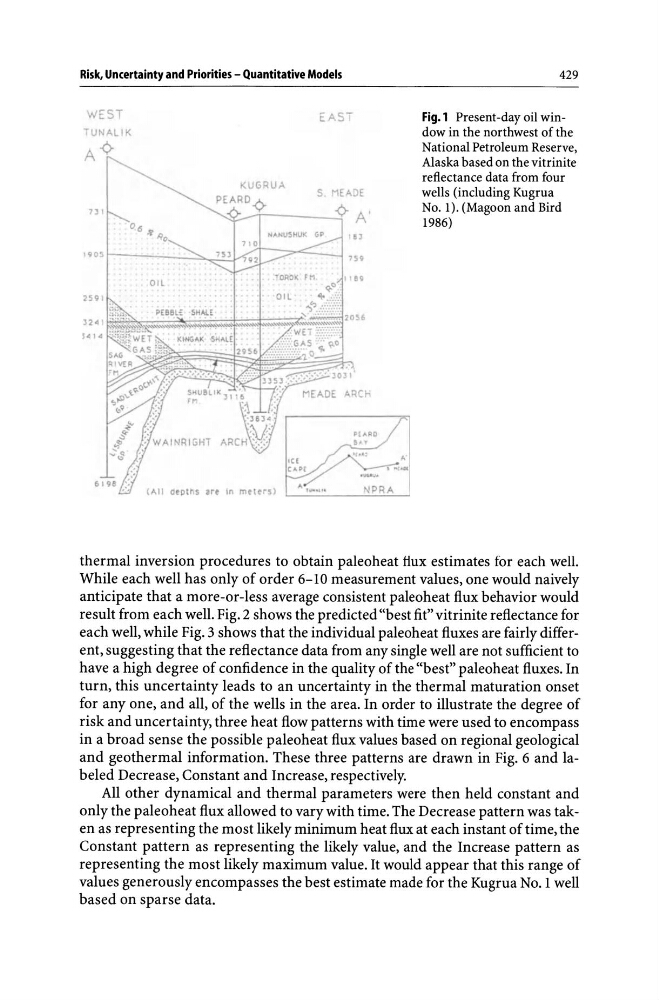
Fig.l Present-day oil window in the northwest of the
National Petroleum Reserve,
Alaska based on the vitrinite
reflectance data from four
wells (including Kugrua
No.1). (Magoon and Bird
1986)
thermal inversion procedures to obtain paleoheat flux estimates for each well.
While each well has only of order 6-10 measurement values, one would naively
anticipate that a more-or-less average consistent paleoheat flux behavior would
result from each well. Fig. 2 shows the predicted "best fit" vitrinite reflectance for
each well, while Fig. 3 shows that the individual paleoheat fluxes are fairly different, suggesting that the reflectance data from any single well are not sufficient to
have a high degree of confidence in the quality of the "best" paleoheat fluxes. In
turn, this uncertainty leads to an uncertainty in the thermal maturation onset
for anyone, and all, of the wells in the area. In order to illustrate the degree of
risk and uncertainty, three heat flow patterns with time were used to encompass
in a broad sense the possible paleoheat flux values based on regional geological
and geothermal information. These three patterns are drawn in Fig. 6 and labeled Decrease, Constant and Increase, respectively.
All other dynamical and thermal parameters were then held constant and
only the paleoheat flux allowed to vary with time. The Decrease pattern was taken as representing the most likely minimum heat flux at each instant of time, the
Constant pattern as representing the likely value, and the Increase pattern as
representing the most likely maximum value. It would appear that this range of
values generously encompasses the best estimate made for the Kugrua No.1 well
based on sparse data.
WEST
-Ut-ALI K
A<>
Oil
EASI
S MEA!)E
........,---_...::t<> A'
I'IIANUSHU
GP
TOAOK FM .
Oil
181
759
1 e9
~[AP:D
e.r
~CA("£/~:
~
.~~.-.
(All a.plns are In meters)
.. ".~,.
NPRA
429
Fig.l Present-day oil window in the northwest of the
National Petroleum Reserve,
Alaska based on the vitrinite
reflectance data from four
wells (including Kugrua
No.1). (Magoon and Bird
1986)
thermal inversion procedures to obtain paleoheat flux estimates for each well.
While each well has only of order 6-10 measurement values, one would naively
anticipate that a more-or-less average consistent paleoheat flux behavior would
result from each well. Fig. 2 shows the predicted "best fit" vitrinite reflectance for
each well, while Fig. 3 shows that the individual paleoheat fluxes are fairly different, suggesting that the reflectance data from any single well are not sufficient to
have a high degree of confidence in the quality of the "best" paleoheat fluxes. In
turn, this uncertainty leads to an uncertainty in the thermal maturation onset
for anyone, and all, of the wells in the area. In order to illustrate the degree of
risk and uncertainty, three heat flow patterns with time were used to encompass
in a broad sense the possible paleoheat flux values based on regional geological
and geothermal information. These three patterns are drawn in Fig. 6 and labeled Decrease, Constant and Increase, respectively.
All other dynamical and thermal parameters were then held constant and
only the paleoheat flux allowed to vary with time. The Decrease pattern was taken as representing the most likely minimum heat flux at each instant of time, the
Constant pattern as representing the likely value, and the Increase pattern as
representing the most likely maximum value. It would appear that this range of
values generously encompasses the best estimate made for the Kugrua No.1 well
based on sparse data.